

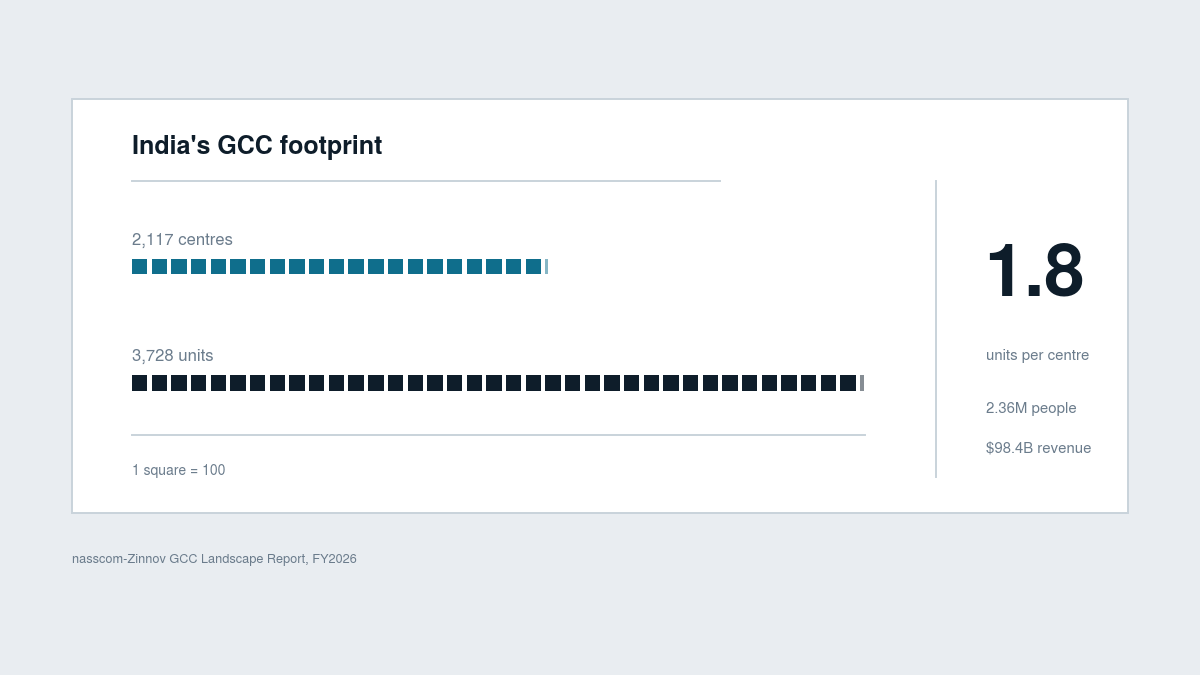
India crossed 2,117 global capability centres in FY2026, operating out of 3,728 separate units. Divide one number by the other and the real story appears: the average Indian GCC now runs from roughly 1.8 locations, not one. The single-city capability centre is already a minority structure, yet most location decisions are still argued as if one city has to win.
That mismatch is where the money leaks. In the majority of engagements we have run, the shortlist arrives with two columns filled in: fully loaded salary and rent per square foot. Both are the least stable inputs in the model. Salary bands reprice every appraisal cycle, and rent is set by a supply gap the occupier does not control. The factors that actually decide whether a centre clears its year-three headcount plan replacement velocity for your exact role mix, the depth of the director-level bench, competitive density inside a 10 km radius almost never make it onto the sheet.
Knowing how to choose a gcc location is therefore less about ranking cities and more about building a defensible scoring instrument, then being disciplined about what it is allowed to tell you. A framework you can hand to a CFO and a global head of engineering, and have both accept the output, is worth more than a consultant’s ranked list of six metros.
India now hosts 2,117 GCCs across 3,728 units, employing about 2.36 million professionals and generating $98.4 billion in revenue, up 32% since FY2021.
The guide below sets out the 12 factors we score, the weights we apply by mandate type, the seven-step process to run it, and the failure patterns that show up when teams skip straight to a decision.
TL;DR
This is a working guide to how to choose a gcc location in India, written for the person who has to defend the choice: a COO, a global engineering leader, or the finance partner signing the lease. It covers what to score, how to weigh it, and where the evidence comes from.
The single number worth remembering: the average Indian GCC now spans about 1.8 units, and 96% of centres set up after FY2021 launched with a product or portfolio mandate from day one. Cost arbitrage stopped being the deciding variable somewhere around 2022. Talent replacement speed replaced it.
By the end you will have a scorecard you can populate in six weeks, a weighting scheme that changes depending on whether you are building an engineering centre or a shared-services hub, and a set of disqualifiers that should knock a city off the list regardless of how well it scores everywhere else. That is a different exercise from applying generic gcc location selection criteria pulled from a vendor deck.
How to Choose a GCC Location: The Short Definition
Choosing a GCC location is the process of scoring candidate cities against weighted factors talent depth for your specific roles, replacement velocity, salary escalation, attrition, real estate, policy incentives, compliance exposure and connectivity to identify where a global capability center can hire, retain and govern its target headcount at a defensible total cost of operations.
Note what the definition excludes. It says nothing about which city is best. There is no context-free answer, and any framework that produces one is measuring the wrong things.
Why most GCC location decisions break in year two
Year one is easy. The first 30 to 50 hires come from a warm market, referrals still work, and the centre looks like a success on every dashboard. The failure surfaces between months 14 and 26, when the centre needs to hire its second and third cohort into the same city while simultaneously backfilling the first.
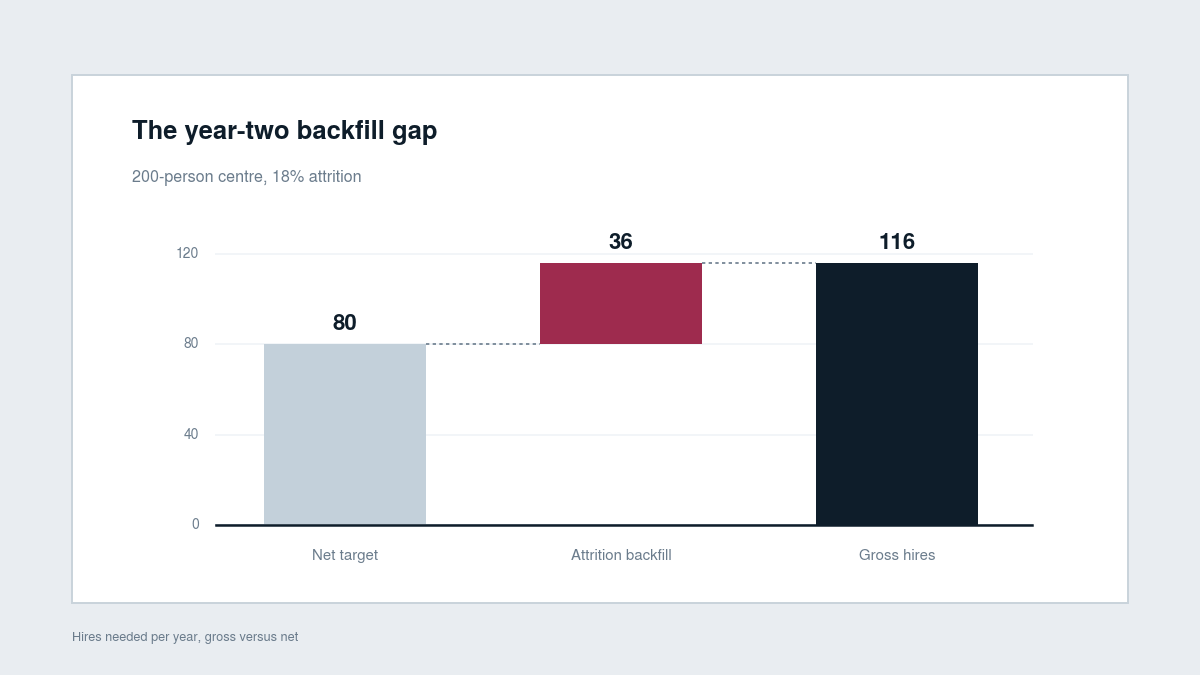
The arithmetic is unforgiving. A 200-person centre in a tier-1 metro running 18% attrition loses 36 people a year. If your net growth target is 80, you are not hiring 80 people, you are hiring 116 and the backfills are harder than the growth hires because they are role-specific and time-critical. Teams underestimate this by three to four times in the original business case, because the case was built on net headcount rather than gross.
Compensation drift compounds it. According to EY’s Future of Pay 2026 report, GCCs are projecting the highest salary increments of any sector in India at 10.4%, with skill premiums of 30–40% for AI, ML, cybersecurity and cloud capabilities. A cost model built on today’s bands and a 6% escalation assumption is wrong by the second appraisal cycle.
The same report puts GCC attrition at 14.1% against an India-wide 16.4%, which sounds reassuring until you decompose it by city and seniority. Aggregate attrition is a national average; you are hiring in one postcode.
The 12-factor location scoring model
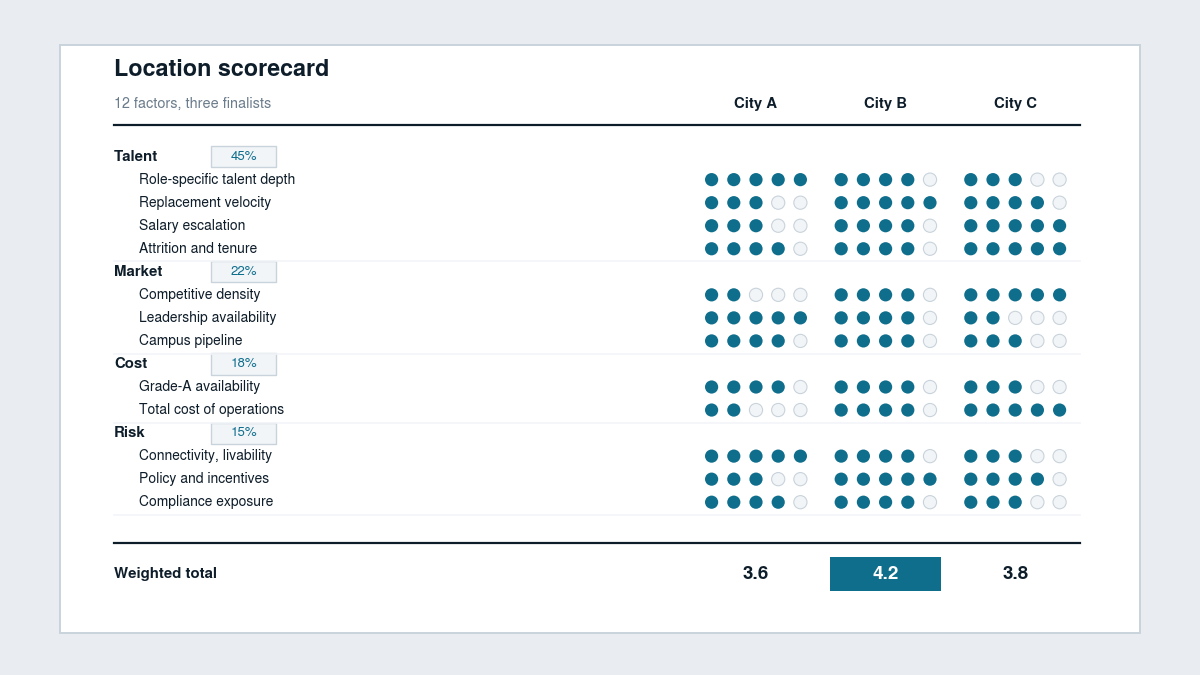
Every factor below is scored 1 to 5 against documented evidence, never against opinion. The location scoring model is only as good as its evidence standard, so we require a source per cell: a job-board pull, a benchmark report, a state policy document, or a named reference call with an operator already in that city.
Talent factors (weight 40–50%)
- Role-specific talent depth. Total IT headcount in a city is a vanity metric. What matters is the count of professionals matching your actual role mix at your actual seniority band. A city with 400,000 IT professionals may still have fewer than 800 people who can pass a platform engineering loop. Run the query for each critical role. If your mandate is infrastructure-heavy and you need to hire cloud engineers at scale, score that pool specifically, not the aggregate engineering talent pool.
- Replacement velocity. How many working days to a shortlist, and to a joined replacement, for each critical role in that city. This is the factor with the highest correlation to year-three success and the one most often absent from the model. Our own benchmark for a vetted shortlist is 7 to 10 working days from job description; a city where a niche role takes 45 days to shortlist carries a hidden cost no rent discount offsets.
- Salary escalation and skill premium. Score the trajectory, not the level. Two cities with identical current bands can diverge 20% in three years if one has three new GCCs opening in the same corridor. Model a five-year band using the sector increment rate, not general inflation.
- Attrition and tenure behaviour. Pull median tenure by role from public profiles rather than asking for a city-level attrition rate. In most engagements we have run, tier-2 sites hold attrition several points below their tier-1 equivalents for the same role, but the gap narrows sharply at senior levels.
Market and ecosystem factors (weight 20–25%)
- Competitive density. Count the employers hiring your exact profile within a 10 km radius, weighted by their hiring velocity. Two large captives opening in the same tech park will reprice your bands within 18 months. It is the cheapest early-warning signal available.
- Leadership availability. Director-and-above talent is the binding constraint in secondary cities. Score the local count of people who have run a function of your target size. Where that number is under 20, plan for relocation, a retention premium, or a two-city structure from day one.
- Campus and academic pipeline. Score placement volume from the three nearest engineering campuses in your target disciplines, plus whether those campuses already run GCC internship programmes. A strong campus hiring pipeline changes your five-year cost curve more than any incentive.
Cost and infrastructure factors (weight 15–20%)
- Real estate and the supply gap. Rent per square foot is an output of market conditions, not a fixed input. Average office rents in Bengaluru and Delhi-NCR crossed ₹100 per sq ft per month for the first time in Q1 2026, with vacancy compressing from 17.2% in 2021 to 13.9%. Score Grade-A office rent alongside available inventory and time-to-fit-out. A city with cheap headline rent and no Grade-A availability in your size band is not cheap.
- Total cost of operations. Build the full stack: salary, statutory employer contributions, rent and fit-out amortisation, IT and connectivity, transport, facilities, and the cost of attrition. Salary arbitrage alone routinely overstates savings by a wide margin because the excluded lines scale differently by city. Score total cost of operations per seat per year, five-year NPV.
- Connectivity and livability. Direct international air links, time zone overlap with the parent’s core hours, commute time at peak, international schools, and healthcare. These matter because they determine whether you can move leaders in, and whether they stay.
Risk and governance factors (weight 15–20%)
- Policy and incentives. Several states now run dedicated state GCC policy instruments with capex and opex support. Score both the headline incentive and the disbursement track record, which are different things. Incentive quality is also where GCC setup services earn their fee: the negotiated position is usually better than the published one.
- Compliance and structuring exposure. Score entity and regulatory friction: single-window clearance maturity, labour code applicability and shift-working permissions, data residency requirements for your sector, and transfer pricing defensibility for the mandate you intend to book in that entity. A location that scores well on talent and badly here is a governance problem waiting for an audit.
How to build your GCC site selection scorecard in seven steps
- Define the mandate first. Product engineering, shared services, and an AI centre of excellence produce three different weightings. Write the mandate and target role mix before touching a city list.
- Set weights and get them signed off. Weights are a business decision, not an analyst decision. Lock them with the CFO and the function head before any data is collected, so the output cannot be argued away later.
- Longlist 6 to 8 cities, then cut to 3. More than three finalists wastes primary research budget; fewer than three removes your negotiating leverage on real estate and incentives.
- Collect evidence per cell, with a source. Job-board pulls, benchmark reports, state policy documents, and three reference calls per city with operators already running centres there.
- Apply disqualifiers before scoring. Any city that fails a non-negotiable is out regardless of total score. Typical disqualifiers: no Grade-A inventory in your size band within nine months, a critical role with no viable local pool, or a data residency conflict.
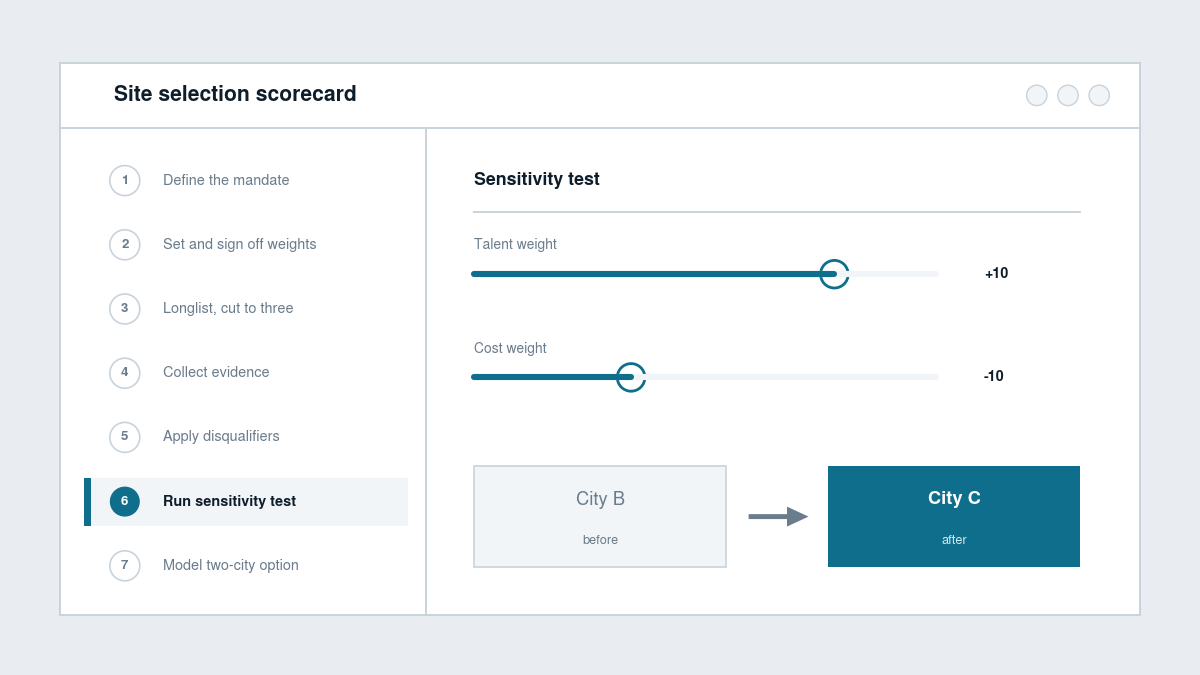
- Run the sensitivity test. Re-run with talent weight up 10 points and cost weight down 10. If the winner changes, your decision is not robust and you need more primary data, not more debate.
- Model the two-city option explicitly. Score the best single city against a hub-and-spoke pair. This is where independent IT consulting services input helps, because the answer often contradicts the original brief.
The output of the gcc site selection exercise should be a one-page scorecard with weights, scores, evidence sources and the sensitivity result. If it cannot fit on one page, it will not survive a board discussion.
What this looks like in practice
A fintech scale-up expanding its engineering base ran a three-city shortlist weighted 50% toward talent. The lowest-cost city won on the original sheet and lost on the sensitivity test, because replacement velocity for two senior platform roles was more than double the next city’s. It chose the second-cheapest option and hit its first-year hiring plan without a band revision, which the original model had priced as a certainty.
An enterprise SaaS company took the opposite route: leadership, architecture and client-facing roles anchored in a tier-1 metro, with QA, support engineering and data operations built as a tier-2 satellite. The tier-2 gcc expansion absorbed roughly 60% of headcount growth at materially lower cost per seat, while the senior bench stayed where it could be recruited.
Across 527+ delivered IT projects and a 98% candidate joining rate, the pattern we see repeatedly is that the two-site structure outperforms the single-city optimum whenever more than a third of roles are junior-weighted and stable.
Best city for capability center: four archetypes, not one ranking
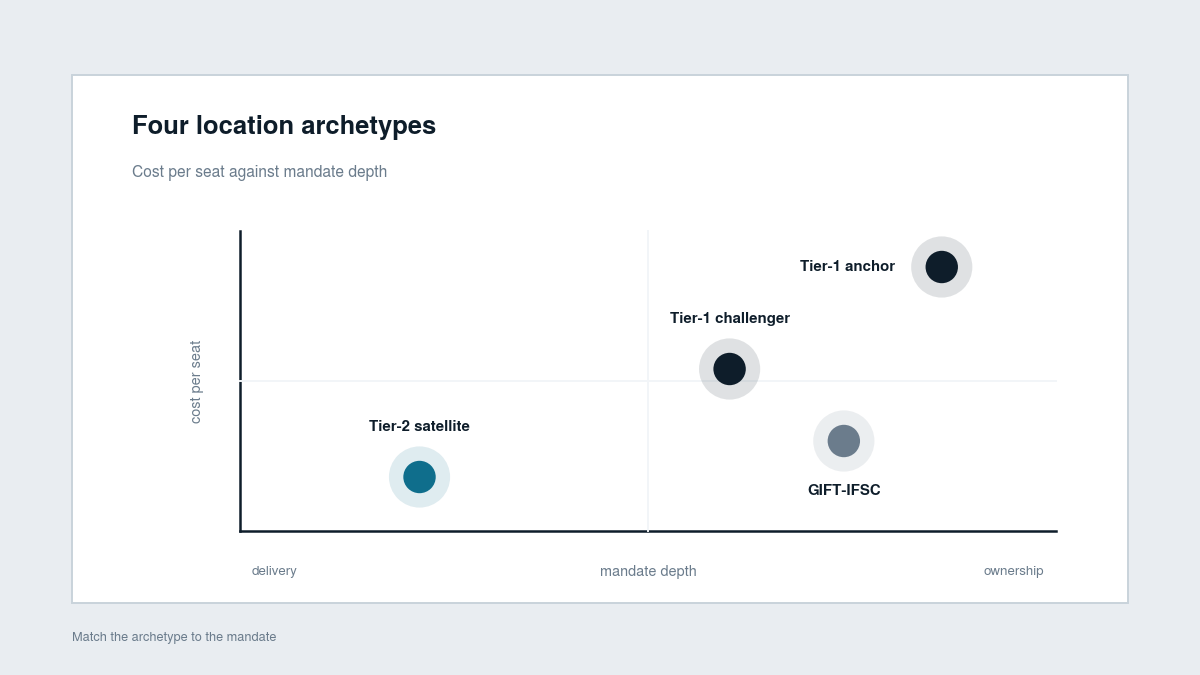
Asked properly, how to choose a gcc location resolves into four repeatable archetypes rather than one ranked list, so the best city for capability center work depends entirely on which archetype your mandate needs.
| City archetype | Best-fit mandate | Cost position | Primary risk to score |
| Tier-1 anchor (Bengaluru, Delhi-NCR, Mumbai) | Product ownership, AI/ML, senior leadership bench | Highest salary and rent | Competitive density, band repricing |
| Tier-1 challenger (Hyderabad, Pune, Chennai) | Scaled engineering, BFSI platforms, mixed seniority | Moderate, below anchor metros | Thinner niche pools than anchors |
| Tier-2 satellite (Coimbatore, Indore, Kochi, Jaipur) | QA, support engineering, back-office, R&D pods | Lowest per seat, largest rent gap | Leadership scarcity, Grade-A inventory |
| Special economic zone / GIFT-IFSC | Regulated financial services, treasury, global markets | Incentive-led, sector-specific | Narrow mandate fit, compliance overhead |
Read it as a filter, not a ranking: a tier-2 satellite scored against a product-ownership mandate should look terrible.
What most teams get wrong
The most common error is treating location selection as a cost exercise when it is a hiring-velocity exercise. Cost differences between shortlisted Indian cities are typically 15–30%; the difference in time-to-hire for a scarce role can be 3x. A centre that misses its hiring plan by two quarters destroys more value than the entire rent saving over a five-year lease.
Three further patterns show up consistently. First, teams score cities against the mandate they have today rather than the one the parent will hand them in year three, and 96% of GCCs established after FY2021 launched with product or portfolio mandates from day one, which means the mandate escalates fast. Second, incentive packages get scored at headline value with no check on disbursement history. Third, and most expensive: the shortlist is built before the weights are agreed, so the weights get reverse-engineered to justify a preference someone already holds.
One specific red flag worth naming, because it costs real money at signing. When a landlord or state agency in a secondary market is unusually flexible on fit-out contribution but firm on lock-in, it is usually pricing in that you will struggle to hire locally and may want out early. Negotiate the exit clause, not the fit-out.
Pressure-test your shortlist before you sign anything
If you are working through how to choose a gcc location and want the model stress-tested before a lease or an incentive commitment, the useful exercise is usually narrow: bring your three finalist cities, your target role mix, and your current weights. What comes back is a replacement-velocity read per role, a competitive-density check on each corridor, and the sensitivity result that tells you whether your preferred city survives a 10-point shift in weighting.
Supersourcing has run hiring and setup engagements across 527+ IT projects with a 98% candidate joining rate, and we will tell you plainly when the answer is a city we cannot help you hire in fastest.
Talk it through: supersourcing.com/contact-us or mayank@engineerbabu.com
FAQ
What factors matter most when choosing a GCC location?
Role-specific talent depth and replacement velocity carry the most weight for engineering mandates, typically 40–50% combined. Cost matters, but it is the most volatile input and the easiest to renegotiate later. Compliance and policy factors act mainly as disqualifiers rather than differentiators, so score them as pass/fail gates before you rank anything.
Is Bengaluru still the best city for a capability center?
For product ownership, AI and senior leadership depth, it remains the deepest market in India. For scaled delivery with a junior-weighted team, it is frequently the wrong answer on both cost and competitive density. Average rents there crossed ₹100 per sq ft per month in early 2026, and band repricing pressure is highest where captive density is highest.
Are tier-2 cities actually cheaper for GCCs?
Yes on rent and junior salaries, much less so on senior and niche roles where scarcity is national rather than local. The saving is largest for large, junior-weighted, stable teams and can invert for a small senior team once relocation and attrition costs are counted. Score it per seat over five years, not per square foot.
How long does GCC site selection take?
A disciplined three-city evaluation with primary research takes six to ten weeks: two weeks to fix the mandate and weights, three to four for evidence collection and reference calls, one for scoring and sensitivity testing, and the remainder for site visits. Compressing below six weeks usually means skipping primary talent data, which is the part that matters.
Which Indian city is best for a GCC if we are hiring fewer than 50 people?
Below roughly 50 seats, hiring-partner depth matters more than city economics, because the fixed cost of building a local employer brand is not recoverable at that scale. Many sub-50 centres launch faster through recruitment process outsourcing in an established metro, then reassess location once the mandate is clear.
Do state incentives change the location decision?
Rarely as a tiebreaker between strong candidates, and never as a reason to override a talent gap. Incentives are worth scoring because the negotiated package usually exceeds the published one, but they are a discount on a decision, not the basis for it. Check disbursement history before assigning any weight.
Should we start in one city or two?
Model both. A hub-and-spoke pair is often better when leadership needs a tier-1 market and more than a third of headcount is junior-weighted. Given that Indian GCCs already average about 1.8 units each, a single-city plan should be treated as the exception that needs justifying.
