

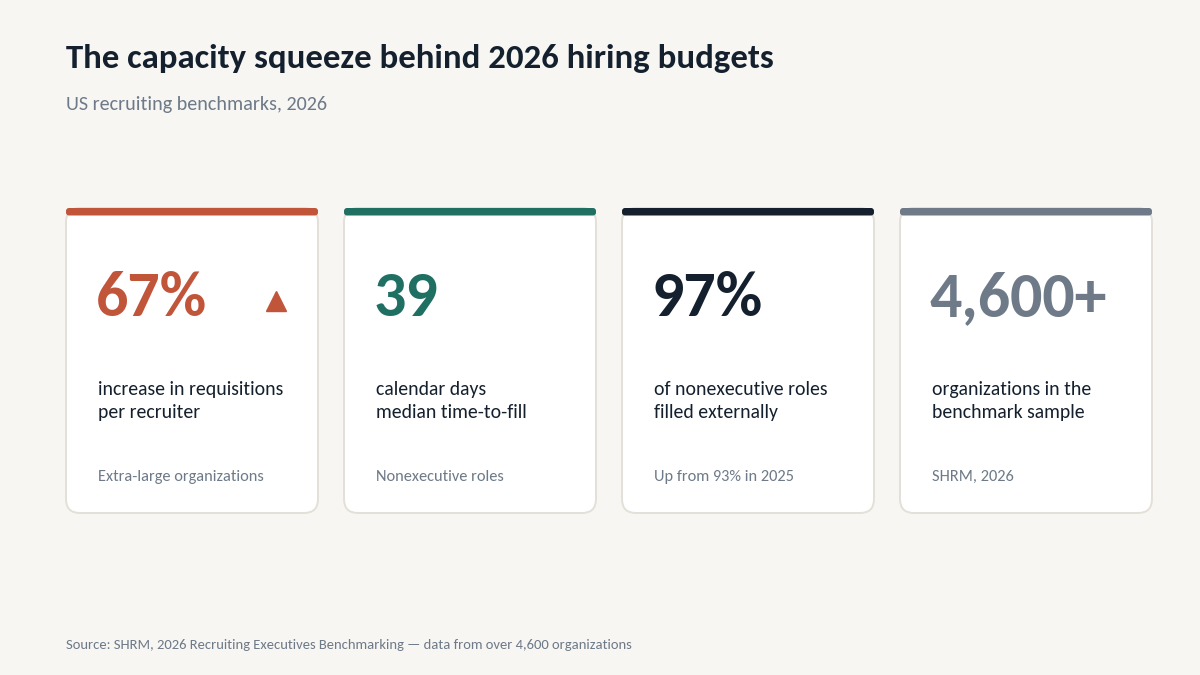
Extra-large US organizations saw median requisitions per recruiter jump 67% in a single year. That is the number that should be driving your 2026 talent budget conversation, and most RPO cost USA benchmarks published online never mention it because the honest version of this analysis is not “RPO is cheaper.” It is “RPO is cheaper past a specific volume, and below that volume it is more expensive.”
The reason the req-load number matters more than any rate card is simple. A recruiter carrying 12 open roles and a recruiter carrying 20 open roles produce very different funnels, and the second one produces worse hires more slowly while costing you the same. Volume is what breaks internal talent teams, and volume is also the variable that determines whether outsourcing pays for itself.
SHRM’s 2026 Recruiting Executives Benchmarking data, drawn from more than 4,600 organizations, found median time-to-fill for nonexecutive roles dropped to 39 calendar days, while 97% of nonexecutive positions were filled externally, up from 93% the prior year. Extra-large organizations absorbed a 67% increase in median requisitions per recruiter over the same period.
Read that combination carefully. External fill rate went up, time-to-fill went down, and recruiter load went up sharply. Someone absorbed that work. In a large share of US enterprises, that someone was a contingency agency invoicing 20–25% of first-year salary per placement, the most expensive possible way to solve a capacity problem.
This guide gives you the arithmetic to decide whether that is still the right trade for your hiring plan, and where the crossover actually sits by role family.
TL;DR
This guide breaks down what recruitment process outsourcing costs in the United States in 2026. It prices RPO cost USA benchmarks by hiring volume and by role family, and it is written for heads of talent, VPs of engineering, and finance partners who are already paying agency fees and want to know whether a different model is worth the switching cost.
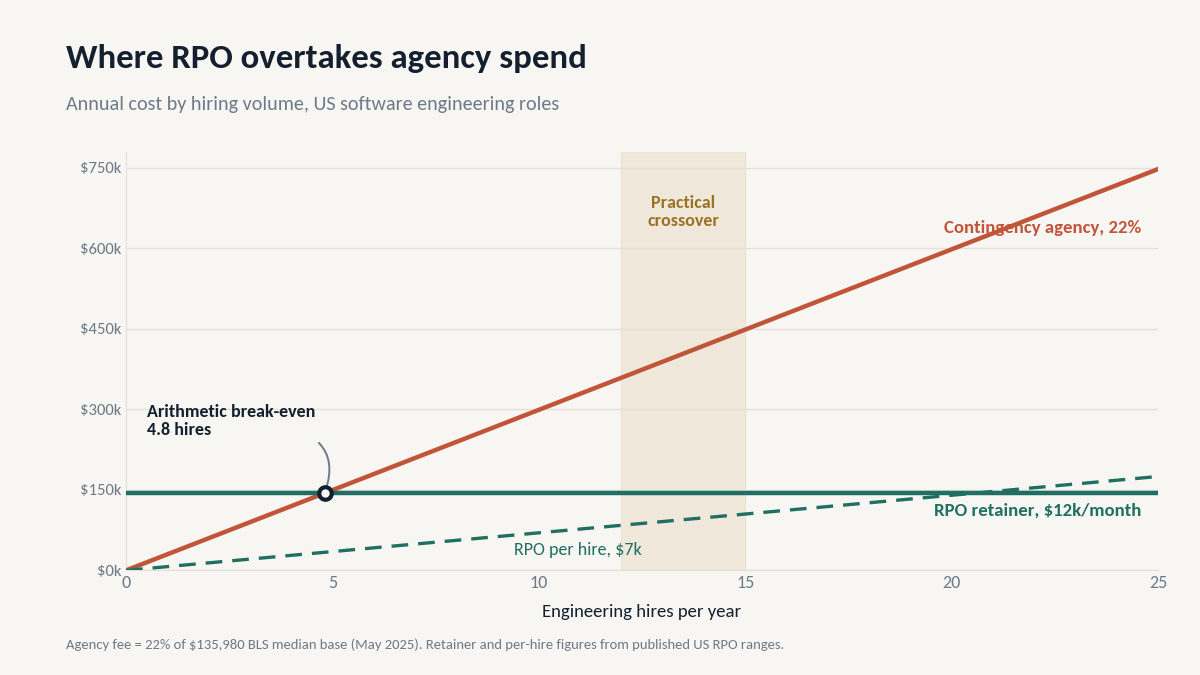
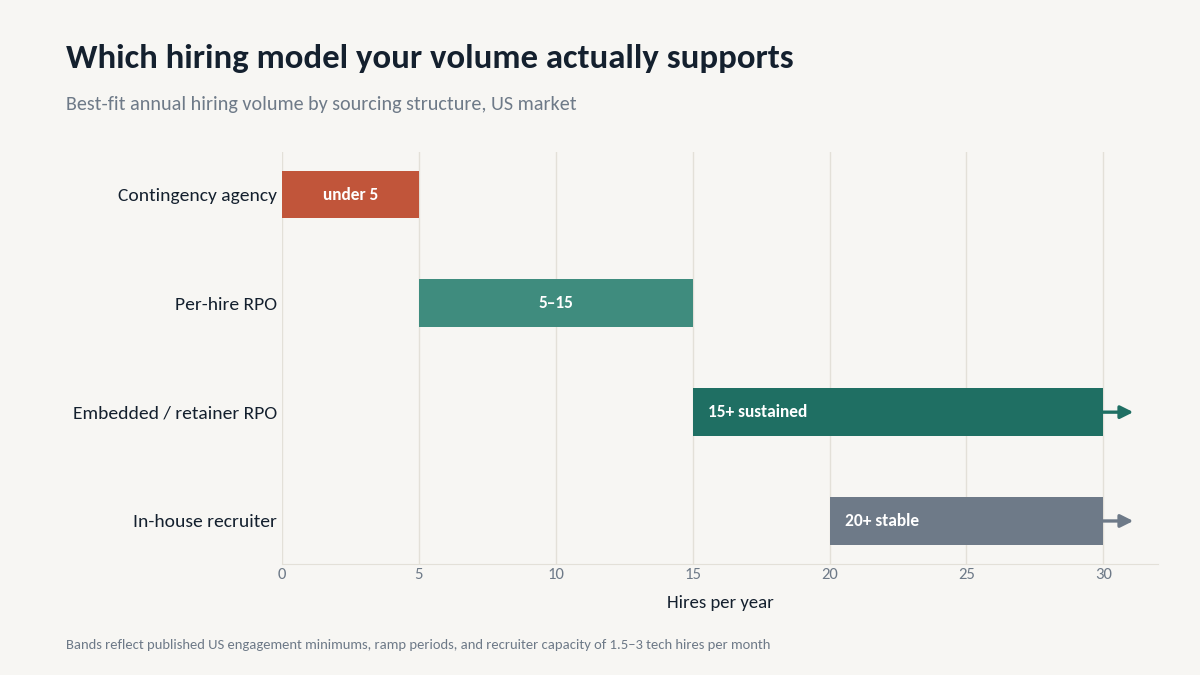
Here is the number that matters: at a US software engineering median base of $135,980, a 22% contingency fee costs roughly $29,900 per hire. A mid-range embedded RPO retainer of $12,000 per month costs $144,000 a year. The arithmetic crossover is under five hires. The practical crossover, once you account for minimum contract terms and ramp time, is closer to 12–15 sustained hires a year.
By the end you will be able to calculate your own crossover point from your own data, read us RPO pricing proposals without being anchored by a headline cost-per-hire figure, and know which three contract clauses decide whether the quoted rate survives month six.
What “RPO Cost” Actually Means in the US Market
RPO cost is the total fee a US employer pays a recruitment process outsourcing provider to run defined parts of its hiring process typically sourcing, screening, interview coordination, and offer management billed as a fixed cost per hire, a monthly management fee per embedded recruiter, a project fee, or a hybrid of the three. It replaces per-placement agency commission with a contracted cost structure.
That last sentence is the whole economic argument. Agency fees scale linearly with salary and headcount. RPO fees scale with scope. Once your hiring plan is large enough, a cost structure that decouples from salary beats one that is a fixed percentage of it.
Every set of RPO cost USA benchmarks below is built on that distinction. Read the numbers as two different cost shapes competing over a volume curve, not as two prices competing on a spreadsheet row.
The Core Problem: Agency Economics Break Quietly, Not Loudly
Nobody sends a memo when the model stops working. Recruitment outsourcing cost USA conversations usually start after a finance review flags a line item that grew 3–4x while headcount grew 1.5x.
The mechanics are straightforward. At the BLS median software developer base of $135,980, a 20% contingency fee is $27,196 and a 25% fee is $33,995. Twelve engineering hires in a year at 22% is roughly $359,000 in placement fees for sourcing and submission only. No process design, no employer brand work, no ATS hygiene, no market intelligence, no scorecard standardization.
You are paying consulting-grade money for a transaction-grade service. That is the gap these RPO cost USA benchmarks exist to price.
There is a second, quieter cost. Contingency agencies are paid on placement, not on retention, which means their incentive ends at the start date. Offer acceptance rate, 90-day retention, and quality of hire sit entirely on your side of the ledger.
In most engagements we have run, the first sign a company has outgrown the agency model is not the invoice, it is a rising re-hire rate on roles that were filled “successfully” nine months earlier.
US RPO Pricing Models, Decoded
Three structures dominate the US market, and the difference between them is not the rate it is who absorbs volume risk. Most published RPO cost USA benchmarks blur the three together into a single average, which is why they are useless for a budget conversation.
Cost-per-hire (variable). A fixed fee per successful start. Published US ranges cluster between $3,000 and $10,000 per hire depending on role seniority, location, and scope. You carry no fixed cost; the provider carries no capacity risk. Best for unpredictable or seasonal demand.
Management fee (fixed). A monthly retainer per embedded recruiter, commonly quoted in the $8,000–$15,000 range in the US market, covering a dedicated recruiter plus process, reporting, and pipeline work regardless of hire count. You carry the fixed cost; the provider carries delivery risk against SLAs. Best for steady-state hiring.
Hybrid. A reduced management fee plus a per-hire success component. This is where most mid-market IT services deals land in 2026, because it splits the risk and survives a hiring freeze without a renegotiation.
RPO Cost Per Hire USA: Benchmarks by Role Family
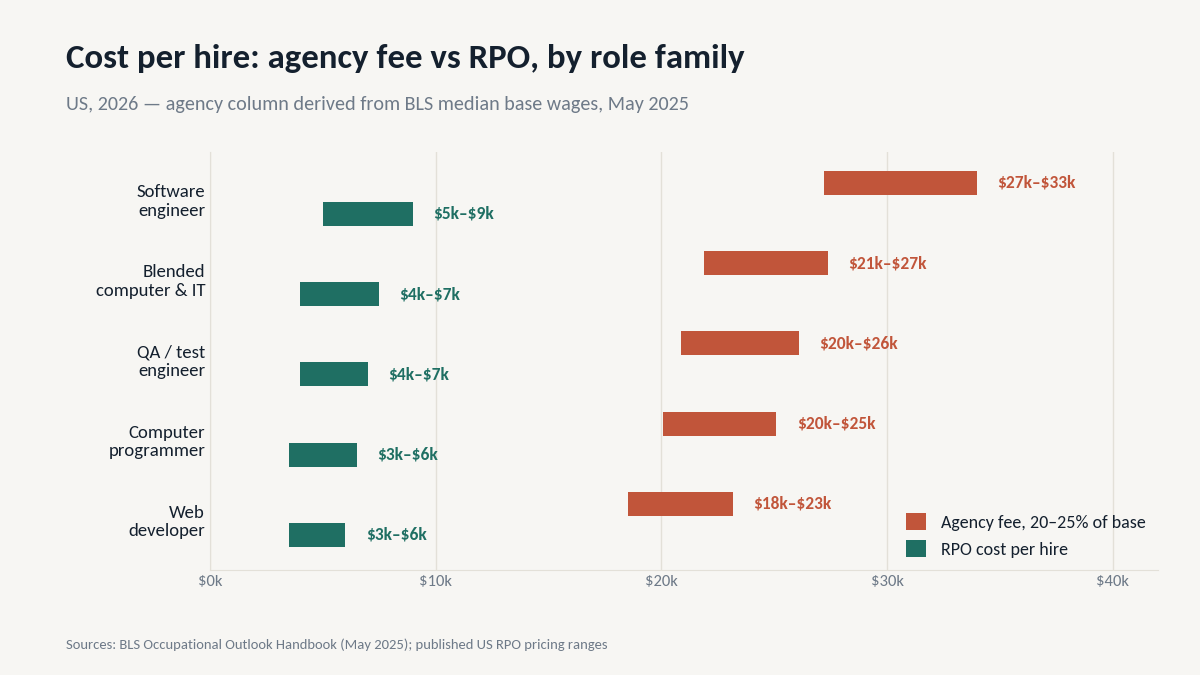
The table below anchors the agency column to published BLS median base wages (May 2025) so you can defend the comparison in a budget meeting. The RPO column reflects the $3,000–$10,000 published US band, weighted by role complexity; a senior backend search costs more to run than a volume requisition to hire QA engineers.
| Role family | BLS median base | Agency fee at 20–25% | Typical US RPO cost per hire |
| Software engineer | $135,980 | $27,196 – $33,995 | $5,000 – $9,000 |
| QA / test engineer | $104,300 | $20,860 – $26,075 | $4,000 – $7,000 |
| Computer programmer / support-tier dev | $100,390 | $20,078 – $25,098 | $3,500 – $6,500 |
| Web developer | $92,650 | $18,530 – $23,163 | $3,500 – $6,000 |
| Blended computer & IT | $109,470 | $21,894 – $27,368 | $4,000 – $7,500 |
The spread is the point. On engineering roles, a per-hire RPO model saves roughly $20,000–$25,000 per placement against a mid-range agency fee. On a $92,650 web developer, the same comparison saves $13,000–$17,000. Higher-salary role families cross over at lower volume, because the agency fee is a percentage and the RPO fee is not.
At What Hiring Volume Does RPO Beat a Staffing Agency?
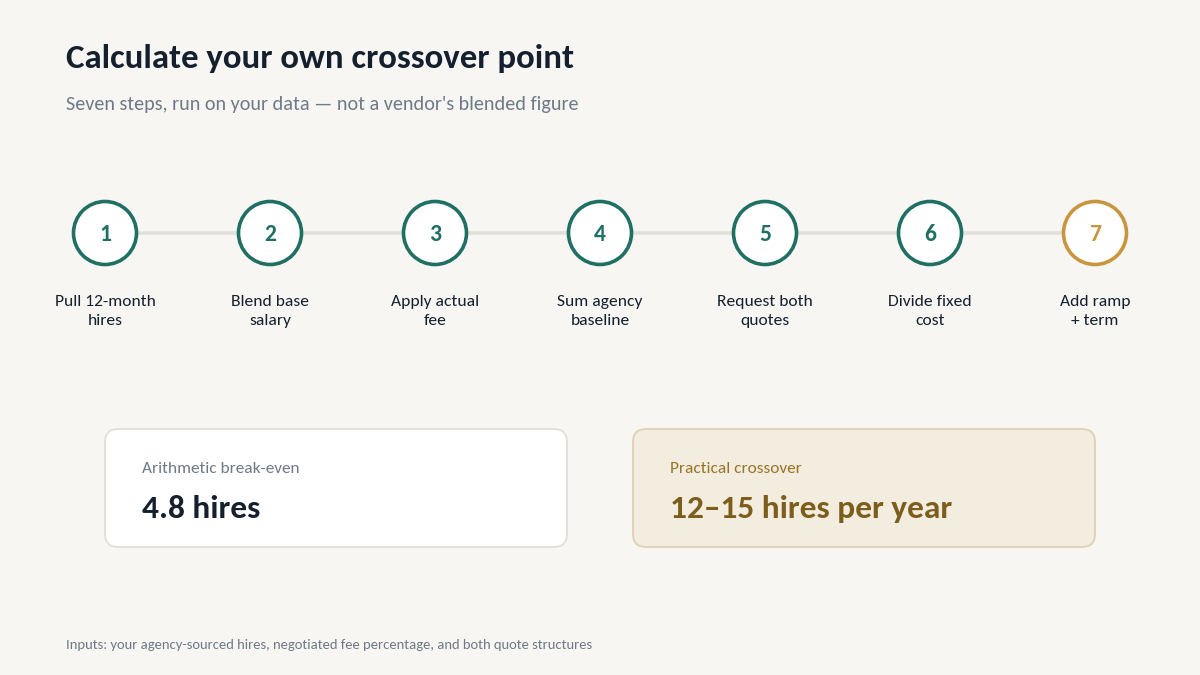
Run this calculation on your own data rather than accepting a vendor’s blended figure. Seven steps:
- Pull 12 months of hires, segmented by role family. Not total headcount agency-sourced hires only. Referrals and inbound do not belong in this model.
- Calculate blended first-year base per family. Use your offer data; use BLS OEWS medians only as a floor if your comp data is incomplete.
- Multiply by your actual negotiated agency fee, not the rate card. Most US buyers at volume are paying 18–22%, not 25%.
- Sum it. This is your true baseline recruitment outsourcing spend, and it is usually 20–40% higher than what talent leaders quote from memory.
- Request two quotes from every provider one per-hire, one management fee for the same requisition volume. Providers who will only quote one structure are telling you something about their delivery model.
- Divide annual fixed RPO cost by your agency fee per hire. That quotient is your arithmetic break-even in hires.
- Add ramp and minimum term. Assume 3–6 weeks before the first shortlist lands and check the minimum engagement length before you compare anything.
Worked example: $144,000 annual retainer ÷ $29,916 agency fee per engineering hire = 4.8. Arithmetic crossover, under five hires.
Now apply step seven. Most US providers hold a 6–12 month minimum term and a one-recruiter floor, and a single dedicated recruiter sustains roughly 1.5–3 tech hires per month once ramped.
That is why the practical crossover for RPO cost USA benchmarks in the US mid-market sits at roughly 12–15 sustained hires per year, not five. Below that, you are buying capacity you cannot fill.
What Moves the Number More Than the Rate Card
Published RPO fees, market quotes move by 15–30% over a multi-year term, and almost none of that drift is the hourly rate. Three clauses do the damage:
- Scope expansion without a re-benchmark. New role types get added to an existing program at the original blended rate, or at a “market premium” surcharge that was never in the signed schedule. Fix: require a written rate for every new role family before it enters the program.
- Replacement terms written as credits, not as days. A credit against future invoices is worth far less than a contractual refill window. Negotiating a day-count a 7–10 day replacement commitment is a defensible task in this market.
- Volume floors with no ceiling. Minimums protect the provider. Ask for a corresponding cap on surge pricing, or your Q4 hiring spike gets repriced.
Where Offshore Delivery Changes the Math
Offshore and blended delivery models US-based client-facing leads paired with offshore sourcing and screening pods are the main reasons published RPO rates United States buyers have not moved in line with US recruiter salaries. The cost arbitrage is real, but it applies to the sourcing layer, not the closing layer.
The same structural logic drives global capability center decisions: keep judgment, stakeholder management, and offer negotiation onshore; move volume-dependent, process-heavy work to a dedicated offshore team. If a provider quotes you a US per-hire rate below the $3,000 floor, ask which functions sit offshore and who owns the hiring manager relationship. There is usually a good answer. Sometimes not.
What This Looks Like in Practice
Enterprise SaaS, US-headquartered, engineering-heavy. A buyer moving from pure contingency to a hybrid BPO structure across a 30-role annual plan replaced an effective agency cost of roughly $29,000 per engineering hire with a blended management-plus-success fee. The operating change that made it work was not the rate it was standardizing scorecards across six hiring managers before the first requisition opened, which cut interview-loop churn in weeks 3–8.
Fintech scale-up, distributed team. A dedicated-pod model delivered interview-ready shortlists in a 7–10 working day cycle from job description to slate, against a 98% candidate joining rate and under 1% drop-off on contract roles across Supersourcing’s engagements. The measurable win was not cost-per-hire in month one; it was that offer acceptance stopped leaking, which is where the real money sits in a market with a 39-day median time-to-fill.
Neither outcome came from a better rate card. Both came from owning the process rather than renting a submission which is the variable RPO cost USA benchmarks are worst at capturing and finance teams care about most.
Agency vs RPO vs In-House: Applying RPO Cost USA Benchmarks
Use this table to identify which structure your current hiring plan actually supports. Applying these benchmarks correctly means matching cost shape to demand shape, not chasing the lowest headline number.
The row that decides most deals is the second-to-last one. Contract IT staffing cost and agency fees buy you a person; a retainer structure buys you a hiring function you keep when the contract ends.
What Most Teams Get Wrong
The most common error is benchmarking cost-per-hire instead of cost-per-accepted-offer. A provider quoting $6,000 per hire against your $29,000 agency fee looks like a 4x saving until you discover the fee is charged on offer acceptance while your acceptance rate sits at 65%. The comparison is not rate versus rate. It is fully loaded cost per started employee, including the requisitions that die at offer stage.
The second error is treating the quote as the decision. A provider who gives you a blended per-hire number without first asking for your offer acceptance rate, your interview-loop length, and your requisitions-per-recruiter ratio has not priced your program; they have priced an average program and assumed you resemble it.
The third is underestimating onboarding friction. ATS permissions, scorecard alignment, and hiring-manager intake calls routinely consume the first two to three weeks of an engagement. Dedicated teams that treat week one as a delivery week rather than an integration week are the ones who declare RPO” slower than agencies” at day 30 and never see the month-four economics.
Pressure-Test Your Numbers Before You Sign
If you are building a 2026 hiring plan and weighing RPO against the agency spend you are already carrying, the useful step is not another vendor demo. Run your own volume, salary bands, and offer acceptance rate through the seven-step calculation above, then hold the result against the RPO cost USA benchmarks in this guide and see where your crossover actually lands.
Supersourcing has run this modeling across 527+ delivered engagements and a decade of enterprise hiring and GCC work, including the specific failure modes that show up in month four rather than month one. Send your role mix and last 12 months of agency spend to mayank@engineerbabu.com, or start at supersourcing.com/contact-us. No proposal unless the math supports one.
FAQ
How much does RPO cost per hire in the US?
Published US ranges sit between $3,000 and $10,000 per hire, with engineering and specialist roles clustering in the $5,000–$9,000 band and higher-volume or support-tier roles closer to $3,500–$6,500. Retainer models are quoted differently commonly $8,000–$15,000 per embedded recruiter per month so compare total annual program cost, not per-unit rates.
Is RPO cheaper than a 20% agency fee?
On a per-transaction basis, almost always. A 20% fee on the BLS median software developer base of $135,980 is $27,196, against a typical RPO per-hire of $5,000–$9,000. The caveat is fixed cost: retainer models only beat agency economics if you actually fill the capacity you are paying for.
What is included in a US RPO management fee?
Typically a dedicated recruiter or pod, sourcing and screening, interview coordination, offer management, ATS administration, pipeline and market reporting, and an agreed SLA. What is frequently excluded: background checks, assessment licenses, job board spend, and employer brand production. Get exclusions listed in the schedule, not described on a call.
At what hiring volume does RPO beat a staffing agency?
Arithmetically, under five engineering hires a year. Practically, 12–15 sustained hires a year, once minimum contract terms, the one-recruiter floor, and a 3–6 week ramp are included. For lower-salary role families the practical crossover moves higher, because the agency fee you are displacing is smaller in absolute dollars.
How long are US RPO contracts, and can you exit early?
Most sit at 6–12 months with a 30–60 day termination notice. Anything longer than 12 months at the first engagement is worth pushing back on. Negotiate a reduced-scope clause: the ability to drop from three recruiters to one without terminating because that is what you will actually need in a downturn.
Does offshore BPO delivery lower US cost per hire?
It lowers the sourcing and screening cost component meaningfully, which is why blended-model providers can quote at the lower end of the US band. It does not reduce the cost of onshore closing work, hiring-manager management, or compliance. Ask which functions sit where before comparing two quotes that look identical on paper.
Should we model this before going to market?
Yes and do it before the first vendor call, because the first quote you see will anchor every number after it. Build your own model, then use public RPO cost USA benchmarks to sanity-check the quotes against it. If you want that model reviewed against real US engagement data rather than a rate card, it is a 30-minute conversation, not a procurement cycle.
