

Most GCC business cases die in the same meeting. The sponsor presents a Year 1 budget entity registration, office lease, 40 salaries and claims 40–50% savings versus home-country costs. The CFO asks two questions: “What does this cost in Year 3 when attrition kicks in?” and “What’s the NPV against just keeping the work here?” The room goes quiet, and the project loses six months.
That silence is avoidable. GCC total cost of ownership is a solvable modeling problem, not a leap of faith. The inputs one-time setup costs, per-FTE run rate, attrition-driven backfill, ramp-up productivity drag are all knowable within labeled ranges. What most teams lack is not data; it’s a structure that connects those ranges into a defensible 5-year number.
The stakes are getting larger, not smaller. India already hosts 1,700+ GCCs generating roughly $64.6 billion in annual revenue, and the trajectory ahead is steep:
Forward-looking stat: India’s GCC market is projected to reach $99–105 billion by 2030, with headcount rising to 2.5–2.8 million across 2,100–2,200 centers
Every one of those new centers will be approved or killed on the strength of a financial model. Yet most published cost guides stop at Year 1 line items and a savings headline, which is precisely the version a finance team will tear apart.
This guide builds the full model: every cost layer, every hidden line, real ₹/$ ranges, an NPV method, and a breakeven view. Read it end to end and you’ll be able to construct and defend a 5-year GCC financial case without hiring a Big Four team to do it for you.
TL;DR
This guide is a complete, step-by-step method for modeling GCC total cost of ownership over five years. It's written for CTOs, CFOs, and heads of engineering or shared services who need a number that survives finance review, not a marketing headline. It covers setup costs, annual run costs, attrition, ramp-up drag, NPV, and breakeven, with real ranges for each.
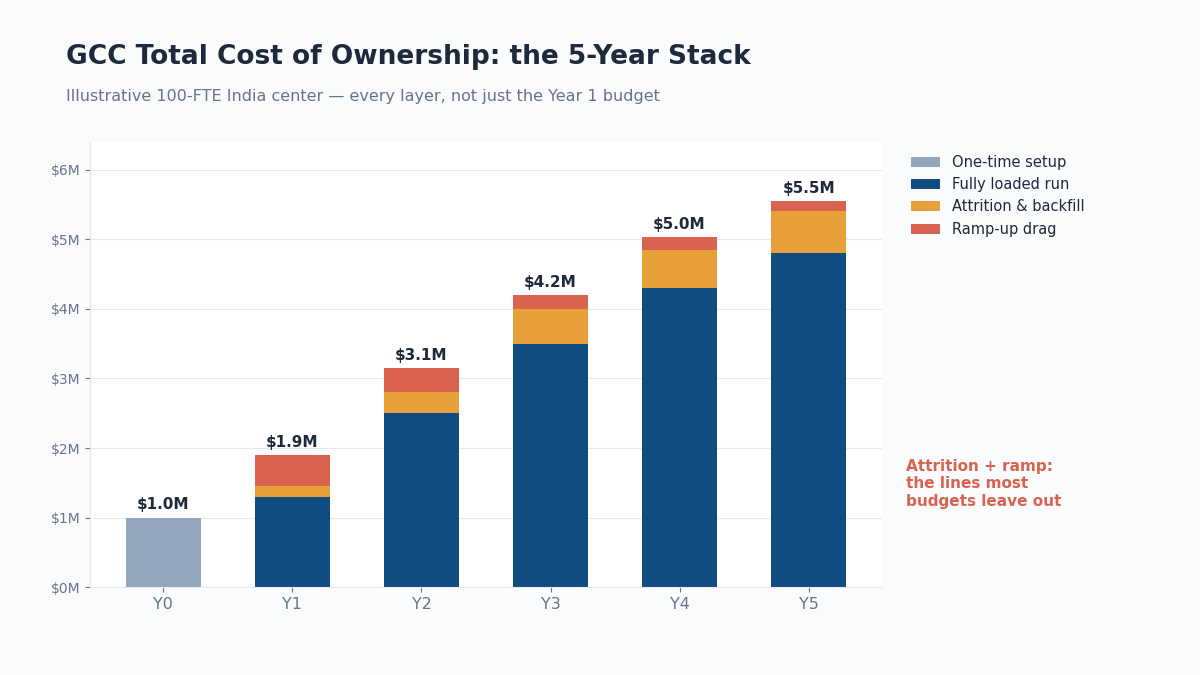
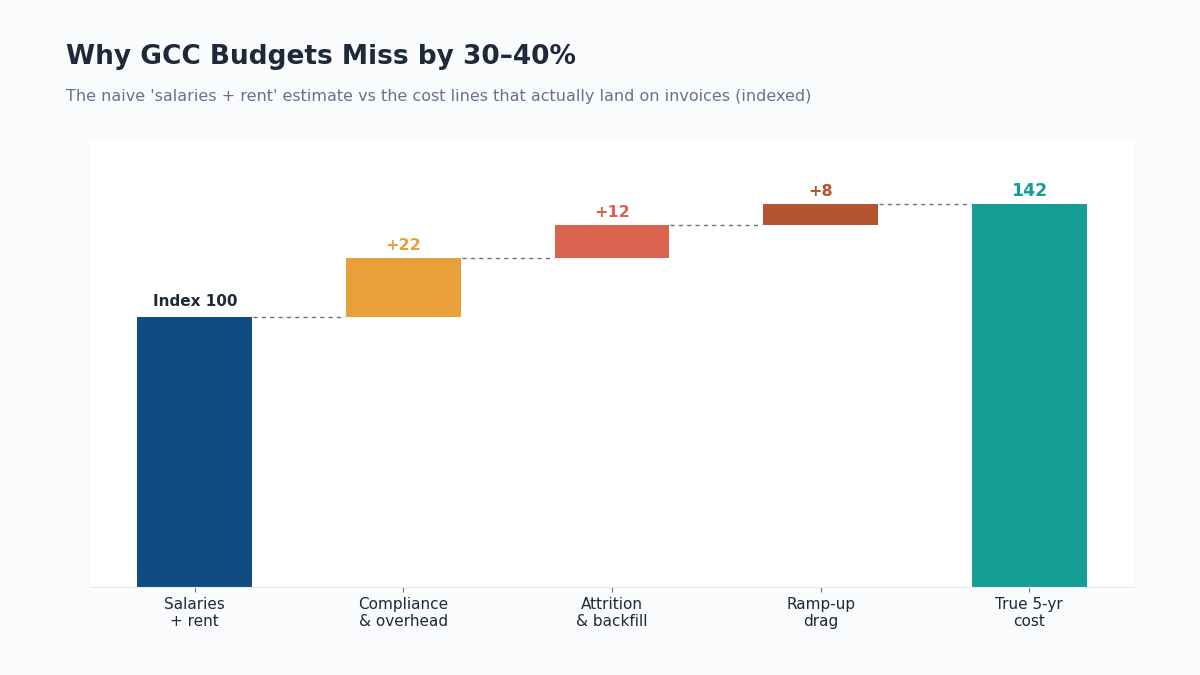
The single most important finding: the two cost lines most teams leave out attrition backfill and ramp-up productivity loss typically add 15–25% to true 5-year cost. Leave them out and your model is wrong by seven figures at 100-FTE scale. A well-run GCC TCO model still shows 30–50% savings versus US or UK baselines, and most centers break even in 24–36 months.
By the end, you'll be able to build the model yourself in a spreadsheet, pick a defensible discount rate, stress-test the case against three failure scenarios, and know exactly which levers move the number. There's a downloadable calculator at the end that does the arithmetic for you.
What Is GCC Total Cost of Ownership?
GCC total cost of ownership (TCO) is the complete, multi-year cost of building and running a Global Capability Center combining one-time setup costs, annual per-employee run costs, attrition and backfill costs, ramp-up productivity losses, and governance overhead usually modeled over 5 years and compared against a home-country baseline using NPV.
What GCC TCO is not:
- Not the Year 1 budget. Setup-year spend is typically only 15–25% of the 5-year total; a Year 1 number tells you almost nothing about the real commitment.
- Not “salary savings.” Comparing Indian salaries to US salaries ignores facilities, compliance, management overhead, travel, attrition, and ramps the lines where bad models fail.
- Not the same as an outsourcing rate card. A vendor’s blended hourly rate bundles their margin and their risk; a GCC’s TCO exposes every line, which is both its advantage and its discipline.
Why a 5-Year GCC TCO Model Matters
A properly built 5 year GCC cost model changes four business outcomes directly. This is the business case for doing the modeling work itself before any center exists.
- Capital approval speed. A model with labeled ranges, sensitivity analysis, and an NPV gets through investment committees in one or two cycles. A savings headline gets sent back for rework in most engagements we’ve seen, that rework costs 3–6 months of calendar time, which at typical burn is more expensive than the modeling effort by an order of magnitude.
- Cost outcomes. Teams that model attrition and ramp explicitly negotiate differently: they choose cities partly on attrition rates (a 5-point attrition difference at 100 FTEs is roughly $250K–$500K over five years), build retention budgets upfront, and avoid the panic-hiring premiums that hit unmodeled centers in Year 2.
- Savings that hold. Realistic models still show strong economics: operating cost savings of 30–50% versus US-based teams are consistently achievable after stabilization, with some functions reaching 60–70% from Year 2 onward once setup costs are amortized. The difference is that a modeled 40% survives audit; an assumed 50% doesn’t.
- Risk visibility. The model forces decisions on exit costs, replacement guarantees, and scale triggers before you’re locked into a 5-year Grade A lease you can’t use.
The one-line test: if your current GCC business case can’t answer “what is our fully loaded cost per FTE in Year 3, including backfill and ramp?”, you don’t have a TCO model, you have a brochure.
The Core Problem: Why GCC Budgets Miss by 30–40%
The pattern across failed or stalled GCC business cases is remarkably consistent. It isn’t that teams estimate salaries wrong, salary data is abundant. It’s that they model the wrong shape of cost.
Where the misses come from:
- Attrition is treated as an HR metric, not a cost line. India’s tech sector runs 15–25% annual attrition (Bangalore trends toward 20–25%; Pune and Hyderabad toward 13–18%). Each departure costs a commonly estimated 50–100% of that role’s annual compensation in recruiting fees, vacancy drag, and lost knowledge. At 20% attrition on 100 FTEs, that’s 20 replacement events per year, a recurring seven-figure-rupee line that simply doesn’t appear in most budgets.
- Ramp-up is assumed to be instant. New hires typically reach full productivity in 3–6 months; complex product engineering roles can take 6–9. In Year 1, when everyone is new, your effective capacity is often 55–70% of paid capacity. Teams that budget 40 FTEs of output in Year 1 and staff 40 FTEs are underestimating cost-per-unit-of-output by 1.4–2x.
- Hidden compliance and overhead lines add 20–30%. Statutory compliance, transfer pricing documentation, employer social contributions (PF, gratuity, insurance), IT security, and leadership travel typically add 20–30% to first-year budgets versus the naive “salaries + rent” estimate.
- Timelines slip, and time is costly. Entity incorporation takes 4–7 weeks; Grade A office identification adds 6–10 weeks; leadership hiring adds 90+ days. Most teams underestimate time-to-first-productive-sprint by 3–4 months during which home-country costs continue at full rate.
The compounding effect: each miss is individually survivable at 8–12%. Stacked, they routinely produce Year 2 actuals 30–40% above the approved business case which is when boards start asking whether the GCC was a mistake, even though the underlying economics were always sound. The problem was the model, not the center.
The Walkthrough: Building Your 5-Year GCC TCO Model From Scratch
This is the core of the guide. Follow the six phases in order and you’ll finish with a working GCC TCO model: a spreadsheet with a Year 0–Year 5 cost stack, an NPV against your home-country baseline, and a breakeven month.
Every figure below is a labeled range drawn from current India GCC market benchmarks. Replace ranges with your own quotes as you collect them, but start with these so the model is never blank.
Phase 1 Define Scope, Headcount Plan, and Baseline (Week 1–2 of modeling)
You cannot cost what you haven’t scoped. Before any spreadsheet work, lock four inputs:
- Function mix. Product engineering, data/AI, cloud infrastructure, QA, finance ops, and support carry very different cost-to-company (CTC) bands and attrition profiles. A center that is 70% senior product engineers models nothing like a center that is 70% operations analysts.
- Headcount ramp curve. Write it as a quarterly table, not an end-state number. A typical mid-market pattern: 15 FTEs by end of Q2, 40 by end of Year 1, 75 by end of Year 2, 120 by end of Year 3, then 10–15% annual growth. Every downstream cost line keys off this curve.
- City and real-estate posture. Bangalore carries a 25–35% cost premium over Hyderabad or Pune with higher attrition (20–25% vs 13–18%); Tier-2 cities (Indore, Ahmedabad, Coimbatore, Kochi) run 20–35% lower on talent cost with roughly 10–12 points lower attrition, at the price of thinner senior talent pools. Under ~150 FTEs, managed/serviced space beats a direct lease; above that, negotiate Grade A directly with a 25–30% expansion buffer.
- The home-country baseline. This is the number your NPV compares against: the fully loaded cost of doing the same work at HQ. For US engineering, use $140K–$220K per FTE fully loaded depending on seniority and metro; for the UK, £90K–£150K. Without a baseline, the model can compute cost but not value.
Budget bands to sanity-check your scope against (India, blended engineering):
- Individual contributor CTC: ₹12–30 lakhs/year ($14K–$36K) mid-level; ₹35–60 lakhs/year ($42K–$72K) senior/staff
- Engineering managers: ₹50–90 lakhs/year ($60K–$108K)
- GCC site head: ₹1–2.5 crore/year ($120K–$300K) and budget 90–120 days to hire this person, because it is the single most consequential hire in the buildout
Red flag: if your sponsor’s headcount plan jumps to 100+ FTEs inside 12 months with no named site head, the model’s Year 1 will be fiction. Ramp curves are constrained by leadership hiring, not by demand.
If specific hard-to-fill roles dominate the plan say the center’s mandate is platform and infrastructure pressure-test the ramp against real market hiring cycles for those roles before committing dates; this is where a partner who can hire cloud engineers or equivalent specialists on a 7–10 working day shortlist cycle materially de-risks the curve. (editor: confirm role-page URL)
Phase 2 Model One-Time Setup Costs (Year 0)
Setup costs are the easiest layer to get right because most of them are quoted by vendors. Build them as a one-time stack, not amortized; you’ll amortize inside the NPV instead.
Setup cost checklist (100-FTE-capacity center, Tier-1 India city):
- Entity incorporation & legal $25K–$75K: company registration (4–7 weeks), FEMA/FDI filings, initial transfer pricing structure, employment contracts, NDA/IP frameworks
- Office fit-out or deposits $150K–$600K: direct-lease fit-out runs $40–$80/sq ft; managed space converts this to opex at $120–$400/seat/month instead
- IT & security infrastructure $150K–$300K: $1,500–$3,000 per seat for hardware and initial software, plus network, VPN, endpoint security, access control
- Recruitment of the founding team $80K–$250K: agency fees typically run 8.33% of CTC per hire; leadership searches cost more
- Advisory / setup-partner fees $50K–$200K depending on how much of location strategy, compliance, and infrastructure you outsource
- Contingency add 15–20% on the subtotal; every first-time buildout finds surprises
Total Year 0 range: roughly $500K–$1.5M for a 100-person-capacity center consistent with current build-operate-transfer market pricing, where a full 100-person BOT engagement totals $5.3M–$10.6M over 36 months including run costs.
For a 10-person pilot, complete first-year cost (setup + salaries + everything) typically lands at $400K–$700K.
The negotiation point most teams miss: SEZ/STPI registration and state incentive packages (Telangana, Karnataka, and several Tier-2 states run dedicated GCC policies with single-window clearance) can shift both setup and run costs meaningfully but only if applied for before you sign the lease, not after.
Phase 3 Model Annual Run Costs (the Per-FTE Engine)
Run cost is the largest layer typically 70–80% of 5-year TCO and it’s best modeled as a fully loaded cost per FTE, then multiplied by the headcount curve from Phase 1.
Build the per-FTE number as a stack:
- Base CTC (from your Phase 1 bands)
- Employer statutory contributions PF, gratuity, insurance: add 12–18% on CTC
- Facilities $1,500–$4,800/year per seat depending on city and space model
- IT run costs $1,200–$2,500/year per seat: licenses, cloud, security tooling
- Recruitment amortization the 8.33% agency fee spread over expected tenure
- G&A allocation finance, HR, admin, compliance: typically 8–12% of the subtotal
- Travel & alignment quarterly leadership trips at $15K–$30K each are critical for culture in the first 12 months; allocate across headcount
Resulting blended fully loaded ranges (2026, engineering-heavy center):
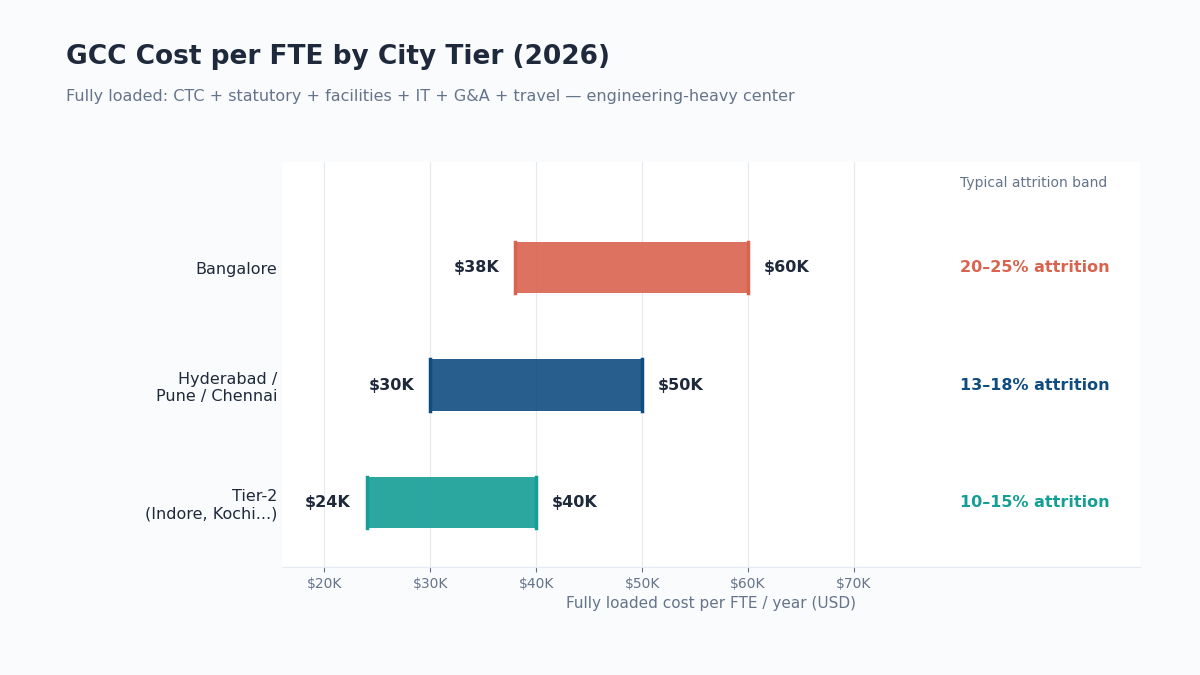
| City tier | Fully loaded cost per FTE/year | Notes |
| Bangalore | $38K–$60K | Deepest senior talent; highest attrition (20–25%) |
| Hyderabad / Pune / Chennai | $30K–$50K | 15–25% cheaper than Bangalore; attrition 13–18% |
| Tier-2 (Indore, Ahmedabad, Kochi) | $24K–$40K | 20–35% lower talent cost; thinner leadership bench |
Multiply each year’s average headcount by the loaded rate, escalate 8–10% annually (India wage inflation in tech runs above CPI), and you have the run-cost spine of the model. If you want a market check on the salary layer specifically, benchmark against current data on the cost to hire offshore developers in India before locking your bands.
Phase 4 Model the Hidden Lines: Attrition and Ramp
This phase is what separates a real true cost of a GCC model from a Year 1 budget. Two lines, both computable.
Attrition & backfill cost the formula:
Annual attrition cost = Headcount × attrition rate × replacement cost per event Replacement cost per event = recruiting fee (8.33% of CTC) + vacancy drag (2–3 months of the role’s output value) + onboarding overlap (1–2 months of double cost) commonly totaling 50–100% of the role’s annual compensation
Working example at 100 FTEs, 18% attrition, $40K average loaded cost: 18 events × ~$28K per event ≈ $500K/year recurring, growing with headcount, and absent from most business cases.
Levers that move this line (model them as scenarios):
- City choice: Pune at 15% vs Bangalore at 23% attrition is worth ~$220K/year at this scale
- Retention budget: centers that spend 3–5% of payroll on retention (comp corrections, learning budgets, career architecture) typically pull attrition down several points the spend usually pays for itself
- Vetting quality at intake: 90-day and first-year drop-off is heavily determined by screening rigor; as a benchmark, disciplined vetting processes can hold candidate joining rates near 98% and contract-role drop-off under 1%, versus industry norms where 10–15% of accepted offers never convert
Ramp-up drag the formula:
Ramp cost = new hires × (months to full productivity ÷ 2) × monthly loaded cost Using 3–6 months to full productivity, each new hire effectively costs 1.5–3 months of “paid but not yet productive” time
In Year 1, when the entire center is new, apply a 55–70% effective-capacity factor to planned output. From Year 2, apply ramp drag only to backfills and net-new hires. This one adjustment is why honest models show Year 1 cost-per-unit-of-output roughly 1.4–2x steady state and why centers that promise full Year 1 delivery velocity almost always miss.
Phase 5 Run the GCC NPV Analysis and Find Breakeven
Now assemble the layers into the finance-grade view. A GCC NPV analysis compares two cash-flow streams over 60 months: (A) build and run the GCC, (B) keep the work at the home-country baseline.
Step by step:
- Lay out Stream A by year: Year 0 setup + each year’s run cost + attrition cost + ramp cost + governance overhead
- Lay out Stream B: equivalent-output home-country FTE cost, escalated 3–4%/year remember to size Stream B against effective GCC capacity, not paid headcount, or you’ll flatter the GCC
- Compute annual net savings: B − A per year (Year 0 and often Year 1 will be negative that’s normal)
- Pick a discount rate: use your company’s WACC or hurdle rate; 10–14% is typical for this class of investment. Higher rates penalize the GCC’s back-loaded savings, so state the rate explicitly in the deck
- Discount and sum: NPV = Σ (net savings in year t) ÷ (1 + r)^t
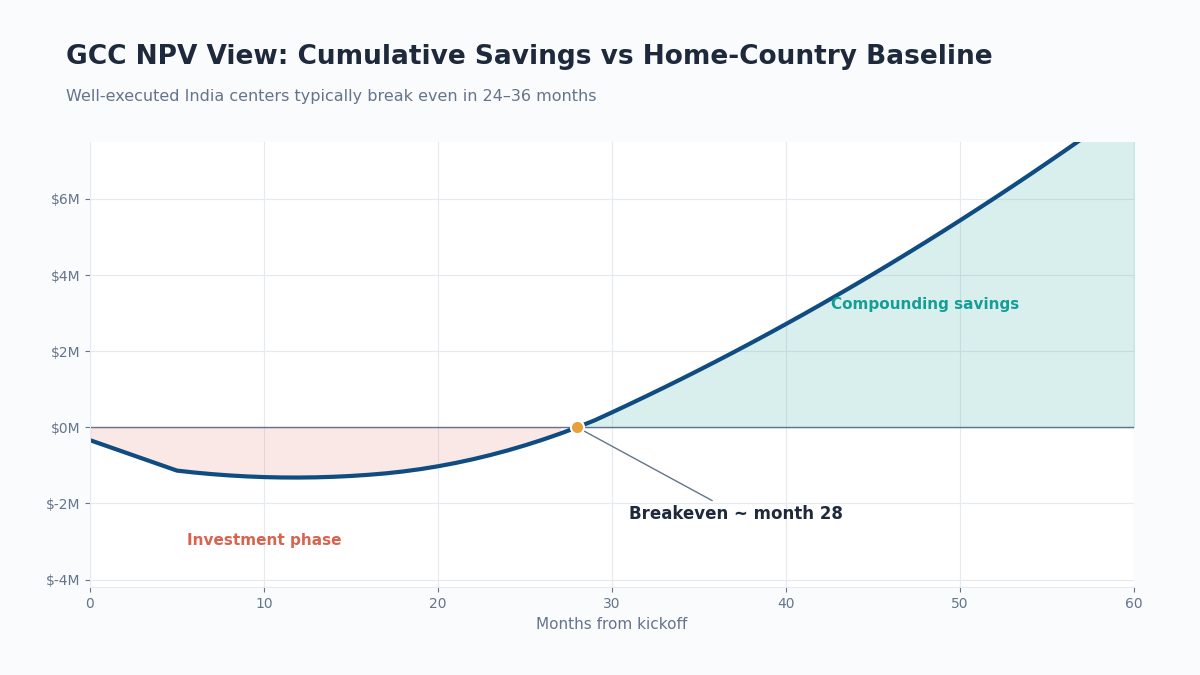
- Find breakeven: the month cumulative undiscounted net savings cross zero. Well-executed India GCCs typically break even in 24–36 months; sub-20-month claims usually mean someone skipped Phase 4
- Run sensitivity analysis on three variables: attrition ±5 points, wage inflation ±3 points, ramp duration ±2 months. If NPV stays positive across all three, the case is robust; if one variable flips it negative, that’s your governance KPI for the first two years
What a healthy output looks like at 100 FTEs (illustrative, Tier-1.5 city): ~$1M setup, ~$4.2M average annual all-in run by Year 3, versus a ~$9M home-country baseline for equivalent effective capacity steady-state savings of 35–50%, NPV solidly positive at a 12% discount rate, breakeven around month 28.
Phase 6 Governance: Track Actuals, Scale, or Exit
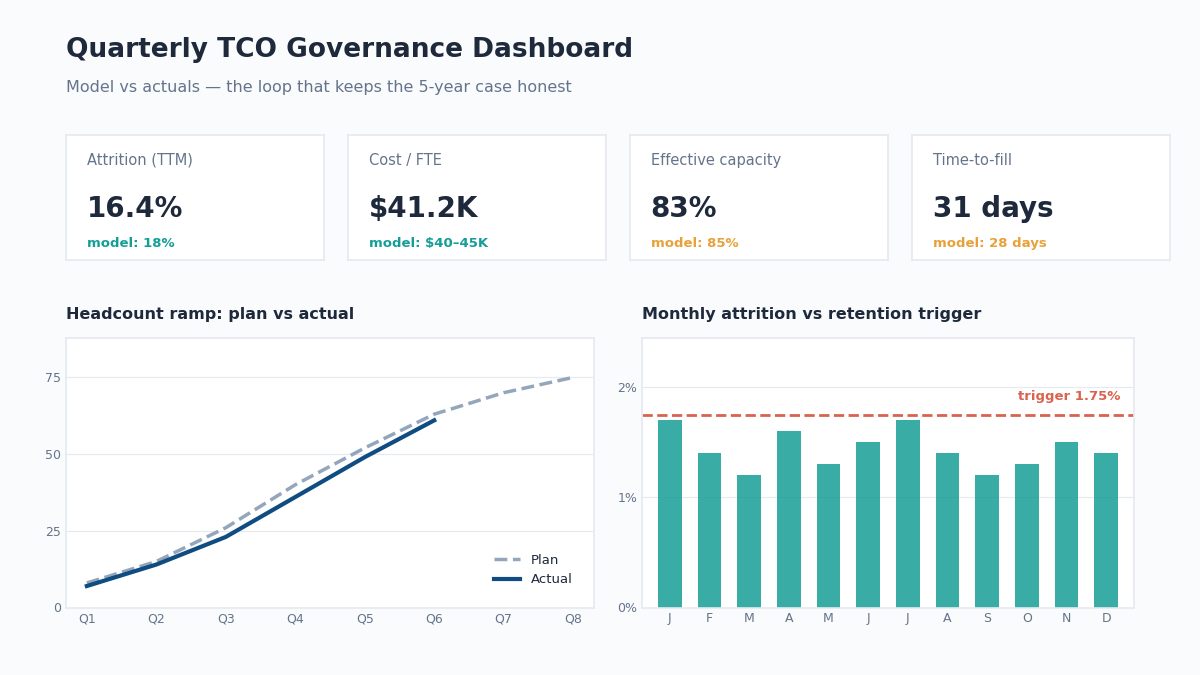
A TCO model that isn’t reconciled against actuals dies within two quarters. Build the governance loop into the model itself.
Quarterly model-governance checklist:
- Reforecast the headcount curve against actual hiring velocity time-to-fill is your earliest leading indicator
- Track fully loaded cost per FTE against the modeled band (only meaningful from ~25 FTEs; below that, fixed-cost amortization distorts it)
- Track attrition monthly and 90-day retention per cohort; trigger the retention-budget lever if attrition runs 3+ points above model
- Reconcile effective capacity (delivery output) against the ramp curve this is the number HQ actually cares about
- Review scale triggers: pre-agree the headcount and cost-per-FTE thresholds at which you expand space, add a second city, or renegotiate vendor terms
- Maintain the exit/transfer schedule: replacement guarantees in staffing contracts (7–10 day replacement windows are negotiable and worth insisting on), lease break clauses, and if you’re in a BOT structure the transfer valuation formula, agreed on day one, not at transfer
Red flag: BOT management fees run 12–18% of operating costs; if your provider resists a pre-agreed transfer formula or wants the fee on gross rather than defined opex, the 5-year math changes materially. Model both fee bases before signing.
Case Studies: What the Model Looks Like in Practice
These are outcome-first snapshots from real engagements delivered by Supersourcing’s talent and GCC delivery teams, chosen because each one moved a specific line in the TCO stack.
Paytm 100+ engineers, compressed ramp curve. India’s largest digital payments platform needed 100+ engineers and key professionals delivered against an aggressive product roadmap. Structured sourcing from a pre-vetted talent pool cuts time-to-fill dramatically versus open-market hiring, which in TCO terms shortens the ramp-drag window and pulls breakeven forward the same headcount curve, reached months earlier, at lower vacancy cost.
Adani One RPO for rapid, niche workforce expansion. Scaling to 500+ employees and $90M revenue within two years required sourcing niche digital talent at a pace internal TA couldn’t sustain. A dedicated recruitment process outsourcing engagement absorbed the volume spike without permanent recruiter headcount converting a fixed G&A cost into a variable one, which is exactly the flexibility a Year 1–2 GCC cost model needs. (editor: confirm RPO page URL)
Contract-role stability protecting the attrition line. Across contract and dedicated-team engagements, disciplined multi-stage vetting has held candidate joining rates at 98% with under 1% drop-off on contract roles. In model terms: every avoided no-show or early exit removes a full replacement-cost event (50–100% of annual comp) from the attrition line screening quality is a TCO lever, not an HR nicety.
Decision Framework: GCC vs BOT vs Staff Augmentation vs Outsourcing
The 5-year model changes shape depending on the operating model you choose. Use this framework before finalizing the spreadsheet; the structures differ far more on risk and control than on headline cost.
| Dimension | DIY GCC (own entity) | Build-Operate-Transfer | GCC-as-a-Service / managed | Staff augmentation | Outsourcing (vendor) |
| 5-yr cost profile | Highest Year 0, lowest steady-state | Mid setup + 12–18% mgmt fee, then converts to DIY economics | Low setup, per-seat premium throughout | Near-zero setup, per-FTE premium | Rate card; vendor margin embedded |
| Time to first team | 6–9 months | 3–5 months | 6–10 weeks | 2–4 weeks | 4–8 weeks |
| Control & IP | Full | Full at transfer | High | High (your management) | Contractual only |
| Attrition risk carrier | You | Provider, then you | Shared | Provider (replacement SLAs) | Provider |
| Best fit | 100+ FTE ambition, 3–5 yr commitment | Want DIY economics without setup risk | 10–75 FTEs, speed-first | Bridging gaps, pre-GCC pilots | Non-core, well-specified work |
How to choose in three questions:
- Is the work strategic and long-lived? If yes, only own-entity or BOT protects IP and compounding capability; this is the classic IT staffing vs. in-house hiring trade augmentation buys speed, ownership buys compounding value.
- Is your 5-year headcount ambition above ~100 FTEs? Below that, entity fixed costs amortize badly; managed models usually win the NPV.
- Can you absorb setup risk internally? If you have no India operating experience, BOT or a setup partner converts unknown-unknowns into a fee, usually a good trade for a first center. Full-scope GCC setup services covering incorporation, location strategy, hiring, infrastructure, and compliance exist precisely to compress this phase.
A common hybrid that models well: staff augmentation for a 10–15 FTE proof-of-value in months 1–6, running in parallel with entity setup, then converting proven contractors into the founding GCC team which also de-risks the ramp curve because the team is already productive at transfer.
What Most Teams Get Wrong About GCC Costs
Pattern-based observations from real buildouts the opinionated section. Quote freely.
They model the center they want, not the center they’ll get. Business cases assume Bangalore-depth talent at Tier-2 prices, 10% attrition in a 22% market, and full productivity in month one. The model isn’t optimistic; it’s fictional. Rule: every assumption more favorable than the market median needs a named mechanism (a retention program, a city choice, a vetting process) or it reverts to median.
They optimize the smallest line. Teams spend weeks negotiating $30/seat/month on facilities, a rounding error while accepting a hiring process with 15% offer drop-off, which costs 50–100% of annual comp per event. In a 5-year GCC TCO, talent-flow quality moves 10x more money than real estate.
They treat the savings percentage as the KPI. A 55% savings claim on a center that delivers 60% of promised capacity is value destruction. The metric that matters is cost per unit of effective output versus baseline which is why the ramp curve belongs in the model, not in a footnote.
They discover compliance costs on invoices. India GCC operation triggers 40+ recurring statutory obligations across ROC, FEMA, income tax, GST, and employment law. Transfer pricing documentation alone is a standing annual cost. Teams that don’t model 20–30% overhead on top of salaries+rent aren’t saving money; they’re deferring the recognition of it.
They defer the exit math. Replacement guarantees, lease break clauses, BOT transfer formulas, and IP assignment terms all cost nothing to negotiate on day one and a fortune to negotiate under duress. A TCO model without an exit column isn’t finished.
Cost & Timeline Reality Check
The section most competing content skips: actual ranges by scenario, with drivers. All figures are current-market labeled ranges for India; treat them as modeling starting points, not quotes.
5-year TCO by center size (engineering-led, Tier-1.5 city, includes setup, run, attrition, ramp, G&A):
| Scenario | Year 0 setup | Steady-state annual run | Indicative 5-yr TCO | Typical breakeven |
| 10-FTE pilot | $100K–$250K | $350K–$600K | $1.8M–$3M | 18–30 months |
| 50-FTE center | $350K–$800K | $1.6M–$2.8M | $8M–$13M | 24–36 months |
| 150-FTE center | $800K–$1.8M | $5M–$8.5M | $24M–$38M | 24–34 months |
What drives the number up:
- Bangalore-only location strategy (+25–35% on nearly everything, plus higher attrition)
- Senior-heavy role mix (staff+ engineers at ₹35–60 lakhs CTC vs mid-level at ₹12–30 lakhs)
- Unmanaged attrition above 20% (each 5 points ≈ $250K–$500K/year at 100 FTEs)
- Direct Grade A lease signed before headcount certainty
What drives it down:
- Hyderabad/Pune or Tier-2 city selection (15–35% lower run rate, lower attrition)
- Managed office space under 150 FTEs; SEZ/STPI and state incentives applied pre-lease
- Vetting rigor that holds joining rates near 98% and minimizes replacement events
- Phased ramp matched to leadership hiring reality, not board enthusiasm
Timeline reality (own-entity path): incorporation 4–7 weeks → office identification 6–10 weeks (parallelizable) → site-head hire 90–120 days → first 15-FTE squad productive around month 5–7 → 50 FTEs around month 12–15. Any plan materially faster than this is either using a partner-led model which is a legitimate way to compress it by 30% or more or it’s optimistic.
Next Step: Stress-Test Your Model Before You Commit
If you’re mid-decision, the highest-leverage move isn’t more research; it’s putting your draft numbers in front of people who have run these buildouts and finding out which assumptions won’t survive contact with the market.
Build your version of the model using the phases above (or the downloadable calculator), then book a working session to review it: Supersourcing’s GCC delivery team will pressure-test your headcount curve, city selection, attrition assumptions, and breakeven math against live engagement data no deck, no pitch, one session.
Bring your model. Leave with a defensible one. → Book a TCO review session
FAQ: GCC Total Cost of Ownership
How much does it cost to set up a GCC in India?
One-time setup for a 100-person-capacity center typically runs $500K–$1.5M covering incorporation, fit-out or deposits, IT infrastructure, founding-team recruitment, and advisory fees. A 10-person pilot’s complete first year setup plus all run costs usually lands at $400K–$700K. City choice, space model (managed vs leased), and how much setup work you outsource are the biggest swing factors.
What is included in GCC total cost of ownership?
A complete model has five layers: one-time setup costs; annual fully loaded run costs per FTE (CTC + statutory contributions + facilities + IT + G&A + travel); attrition and backfill costs; ramp-up productivity losses; and governance overhead. It’s then compared against a home-country baseline via NPV. Any “TCO” figure missing attrition and ramp is a Year 1 budget wearing a costume.
What is the GCC cost per employee per year in India?
Fully loaded not just salary expect $38K–$60K per FTE annually in Bangalore, $30K–$50K in Hyderabad, Pune, or Chennai, and $24K–$40K in Tier-2 cities for engineering-led centers, escalating 8–10% per year with wage inflation. That’s typically 40–60% of the equivalent fully loaded US cost, which is where the durable arbitrage actually lives.
How long does it take for a GCC to break even?
Well-executed centers typically cross cumulative breakeven against the home-country baseline in 24–36 months. Faster claims usually omit ramp drag or attrition. Breakeven arrives sooner with a partner-compressed setup timeline, a lower-attrition city, and a founding team converted from an already-productive augmented squad.
Is a GCC cheaper than outsourcing over 5 years?
Usually yes above roughly 50–75 FTEs of sustained demand, because vendor rate cards embed margin and you never build owned capability. Below that scale, entity fixed costs amortize poorly and managed models or outsourcing often win the NPV. The honest comparison is cost per unit of effective output including setup and ramp run both streams through the same discount rate.
What is a good attrition rate for a GCC in India?
The tech market runs 15–25% annually; Bangalore trends to the high end, Pune and Hyderabad to 13–18%, and Tier-2 cities lower still. A center holding attrition under 15% with a deliberate retention budget is performing well. Model each 5-point improvement as roughly $250K–$500K per year in avoided backfill cost at 100-FTE scale.
What discount rate should I use for a GCC NPV analysis?
Use your organization’s WACC or standing hurdle rate; 10–14% is the common band for this investment class. Because GCC savings are back-loaded, higher rates compress NPV so state the rate explicitly and show sensitivity at ±2 points. If the case only works below 10%, it’s fragile.
How do I pressure-test my model before taking it to finance?
Run three sensitivities: attrition +5 points, wage inflation +3 points, ramp +2 months and confirm NPV stays positive. Then have someone who has actually operated India buildouts review the assumptions line by line; most fatal errors are market-reality errors, not spreadsheet errors. A structured review of your draft model with a GCC delivery team typically takes one working session and catches the misses this guide describes.
