Table of content
This blog takes a detailed look at how to measure quality of hire with precision, why it matters for enterprises, and what strategies leading US companies are using to improve it.
What is Quality of Hire?
Quality of hire is not about how quickly someone was recruited or how much money the hiring team saved in the process. It is a performance measure that captures the long-term value a new employee brings to the organization once they are in the role. In the U.S., this metric has become one of the top priorities for talent leaders, with LinkedIn’s Global Recruiting Trends survey reporting that 40% of companies rank quality of hire as the single most valuable metric in recruiting.
Unlike process-driven indicators such as time-to-fill or cost-per-hire, quality of hire looks at outcomes. Did the new employee meet or exceed their goals? How well did they adapt to the company’s culture? Did they stay long enough to justify the investment made in them? In short, it tells leaders whether the organization is building a stronger, more productive workforce with each hire.
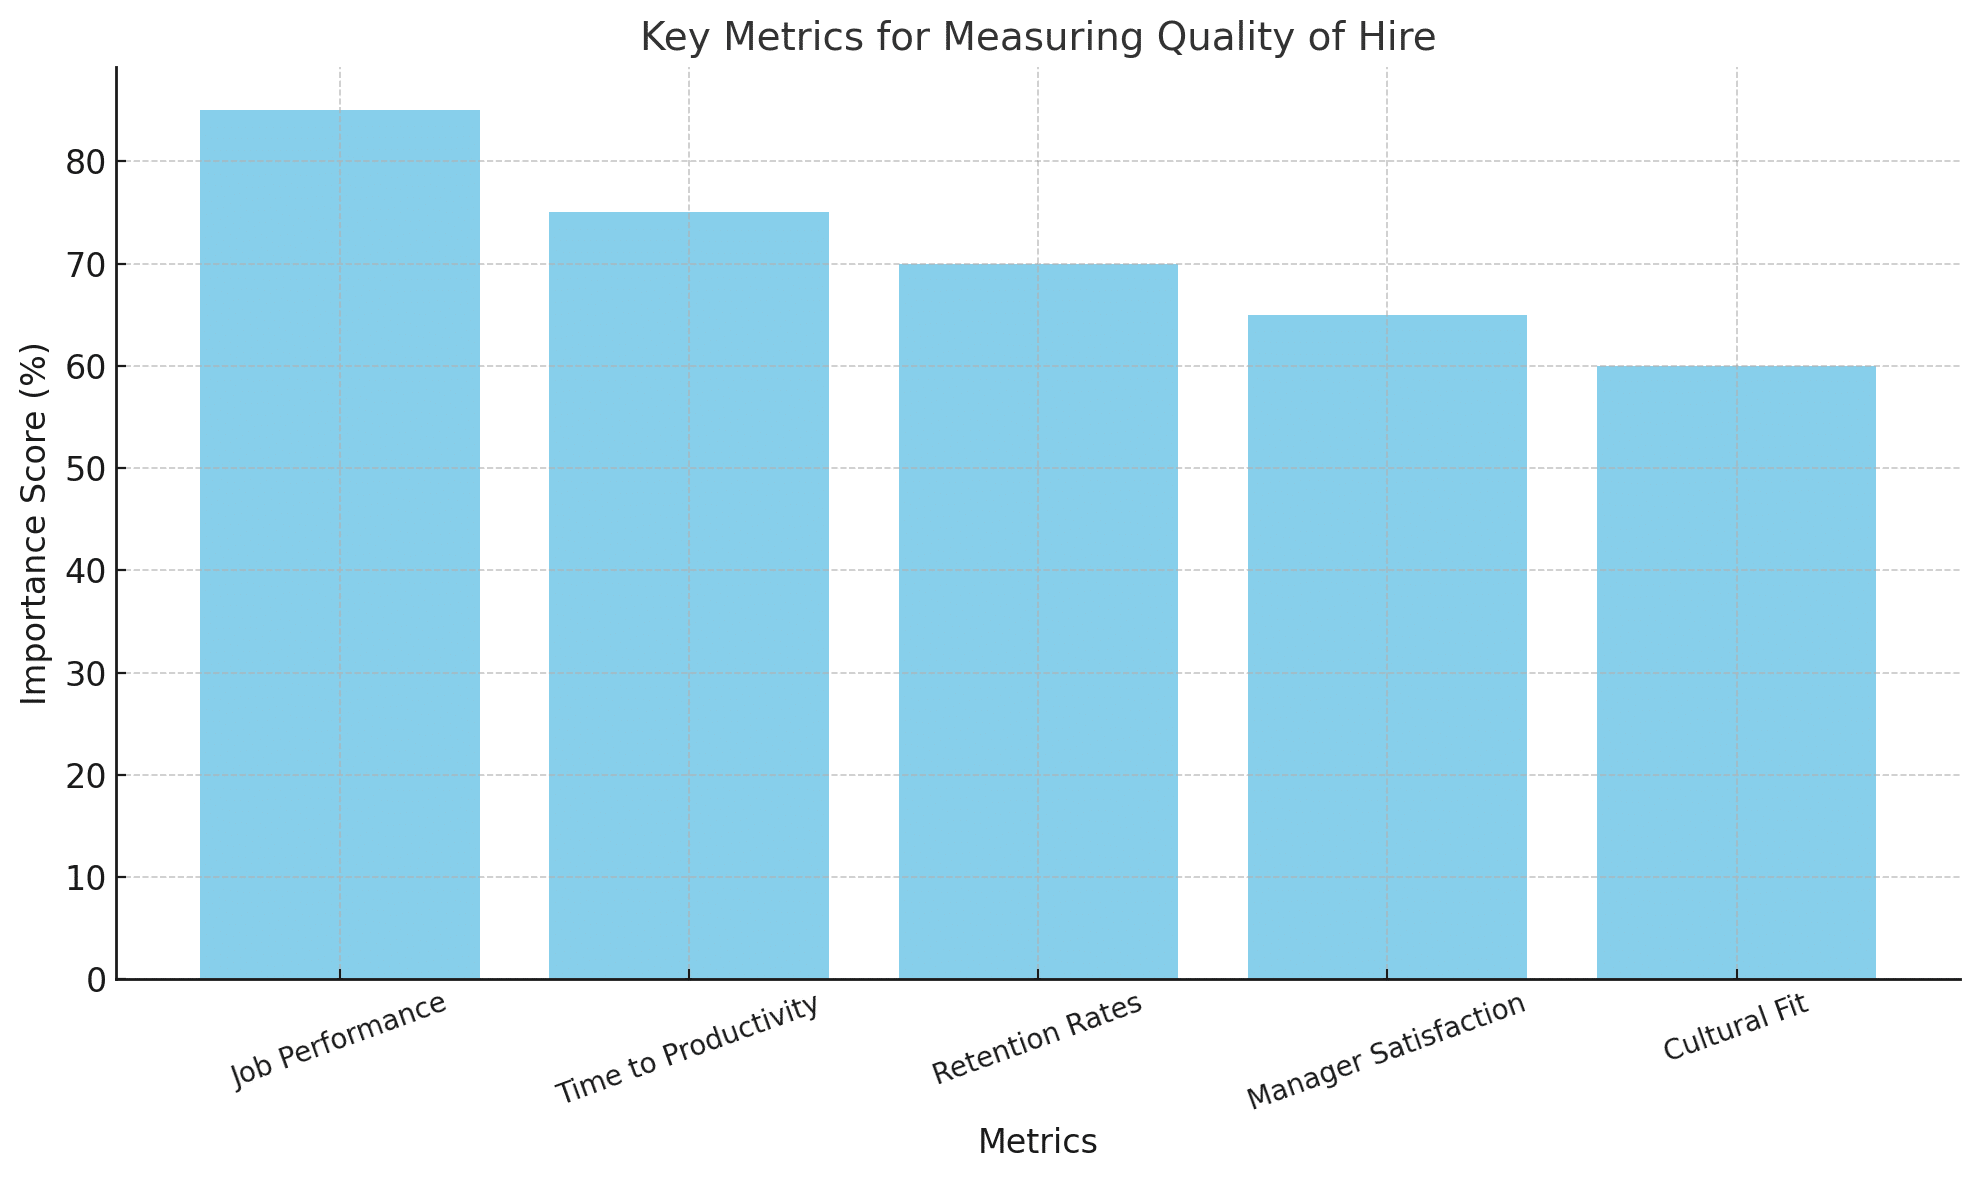
Metrics to Measure Quality of Hire
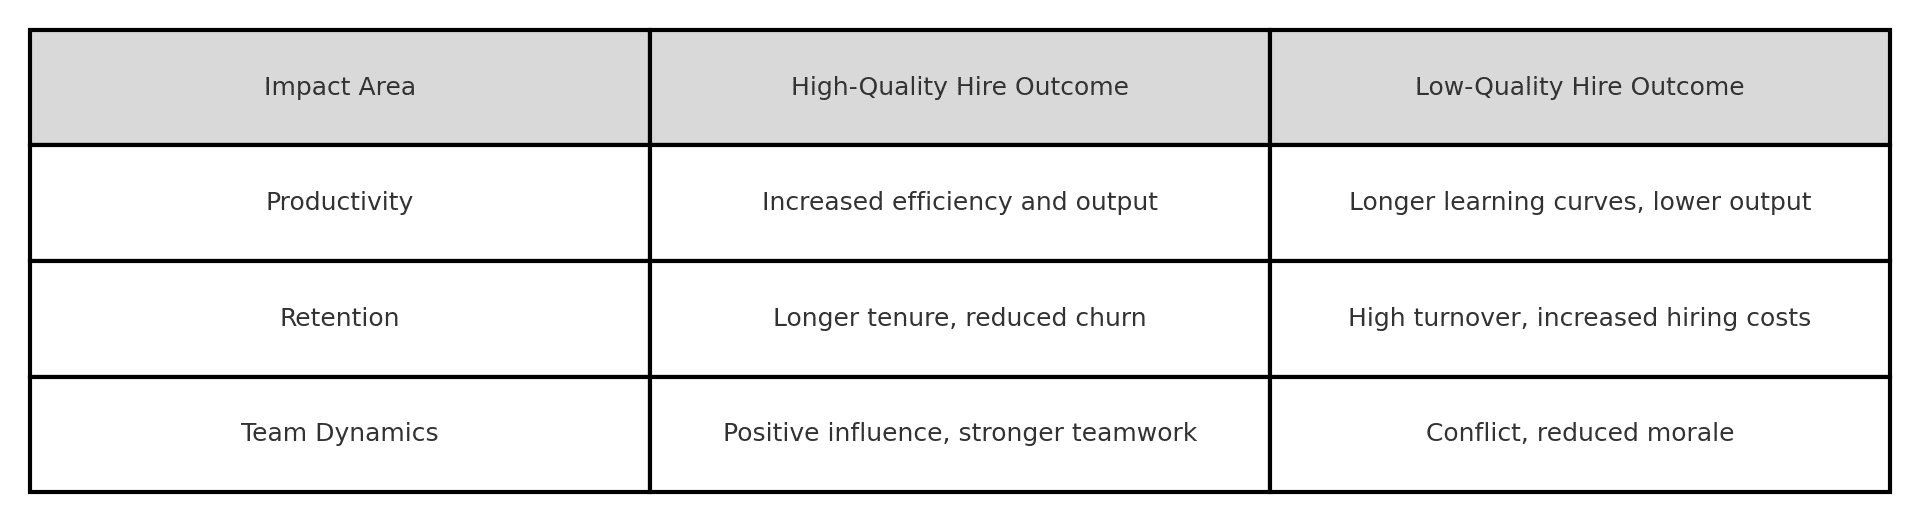
Measuring quality of hire requires more than a single score. Enterprises need a mix of metrics that capture performance, retention, and overall contribution. When tracked together, these measures provide a realistic view of how well recruitment decisions are paying off.
Job Performance
The most direct indicator is whether the employee meets or exceeds the expectations of the role. For example, a software engineer might be evaluated on code quality, peer review acceptance rates, and the speed of bug resolution. A sales professional, on the other hand, would be measured by closed deals, pipeline growth, and customer renewal rates. Performance data is most useful when collected at multiple intervals such as 30, 90, and 180 days. This shows whether early promise translates into long-term results.
Time to Productivity
This metric looks at how quickly a new hire becomes effective in their role. According to the Society for Human Resource Management (SHRM), the average new employee takes 8 months to reach full productivity. Enterprises that design structured onboarding programs often shorten this ramp-up time significantly, leading to faster returns on hiring investments.
Retention Rates
Retention is a powerful proxy for quality. If employees leave within the first year, it often points to poor job fit, weak onboarding, or cultural misalignment. A report by Work Institute found that 37% of U.S. employees quit within the first 12 months. Tracking retention by cohort and role helps companies identify where hiring practices may be falling short.
Hiring Manager Satisfaction
Quantitative metrics alone can miss important context. Manager feedback collected through structured surveys at 30, 60, and 90 days adds valuable insight. Questions such as “Would you hire this person again?” or “Has this hire met the expected level of contribution?” provide a quick reality check on the effectiveness of recruitment decisions.
Cultural Fit and Engagement
Employees who thrive in the company’s culture contribute more than just technical skills. Measuring engagement through pulse surveys, peer feedback, and participation in team initiatives can highlight whether new hires are aligning with company values. High engagement in the first year strongly correlates with higher retention and improved performance.
Data-Driven Approaches to Measuring Quality of Hire
For too long, hiring decisions have been judged on intuition or surface-level metrics like time-to-fill. Enterprises in the U.S. are now moving toward data-driven frameworks that measure whether each hire produces long-term value. The combination of structured data and practical formulas provides clarity for executives and helps HR teams refine their strategies with precision.
Hiring Analytics
Hiring analytics systems bring together applicant tracking data, performance reviews, and employee engagement results into a single view. This integration allows leaders to compare outcomes across roles, departments, and sourcing channels. For instance, analytics can reveal that candidates hired from referrals have 20% higher performance scores but slightly longer ramp-up times compared to those from job boards.
By scoring and benchmarking these results, enterprises can trace back high or low quality-of-hire outcomes to specific recruiting practices. According to Aptitude Research, companies that use analytics in recruitment are twice as likely to improve quality of hire within a year. This is because decisions shift from anecdotal impressions to quantifiable evidence.
Formula Example:
Performance Index = (Average KPI Score ÷ Maximum KPI Score) × 100
If a sales representative averages 42 out of a possible 50 across their KPIs, the Performance Index is (42 ÷ 50) × 100 = 84. That number can then be compared across multiple hires to identify which sources consistently produce top performers.
Role-Based KPIs
Quality of hire is meaningless without role-specific performance measures. Every function has its own version of success. For sales, it might be revenue closed in the first six months. For engineers, it could be code quality, bug resolution speed, and contribution to deployments. The goal is to normalize these into a standard score that can be compared across teams.
Formula Example:
Performance Component = (KPI1 + KPI2 + KPI3 …) ÷ Number of KPIs
If a developer is rated 8 for code quality, 7 for collaboration, and 9 for delivery speed on a 1–10 scale, the Performance Component is (8 + 7 + 9) ÷ 3 = 8.0. This offers a simple but powerful way to quantify contribution in the first year.
Retention and Cultural Alignment
Retention is often misunderstood as a binary measure: did the employee stay or leave. A more meaningful approach is to adjust retention scores by performance so that tenure reflects value, not just time served.
Formula Example:
Retention Score = (Months Completed ÷ 12) × Performance Rating
A high-performing engineer who leaves after nine months with a performance rating of 9 out of 10 would score (9 ÷ 12) × 9 = 6.75. While not perfect, this result signals the employee contributed significantly before departure. At scale, this formula allows enterprises to distinguish between regrettable and non-regrettable turnover.
Manager and Employee Feedback
Surveys with hiring managers and employees at structured intervals create a qualitative dimension to quality of hire. Instead of asking vague questions, organizations can focus on specifics like role readiness, team contribution, and rehire intent. These scores can then be averaged into a Manager Satisfaction Index.
Formula Example:
Manager Satisfaction Score = (Sum of Manager Ratings) ÷ Number of Questions
If a manager rates a new hire 4, 5, 4, and 5 across four questions on a 1–5 scale, the Manager Satisfaction Score is (4 + 5 + 4 + 5) ÷ 4 = 4.5. Normalized to a 100-point scale, that becomes 90, which can be compared across departments.
Composite Quality of Hire
The most complete view comes from combining all components into a weighted composite. A common model gives 40% weight to performance, 20% each to retention and time-to-productivity, and 10% each to cultural fit and manager satisfaction. The weights can be adjusted depending on business priorities.
Formula Example:
Quality of Hire = (Performance + Retention + Cultural Fit + Manager Satisfaction) ÷ Number of Metrics
If a hire scores 8 for performance, 7 for retention, 9 for cultural fit, and 8 for manager satisfaction, the Quality of Hire score is (8 + 7 + 9 + 8) ÷ 4 = 8.0. When multiplied across hundreds of employees, this formula allows enterprises to benchmark quality by role, source, and business unit.
Predictive Analytics and AI
Artificial intelligence takes these formulas a step further by projecting outcomes. Predictive models use early signals such as engagement scores, onboarding completion rates, or first-quarter performance to estimate the likelihood of retention or promotion. Research published in the Harvard Business Review found that organizations using predictive analytics in hiring achieved a 20% improvement in retention compared to those relying only on traditional methods.
This predictive layer allows enterprises not only to measure quality of hire after the fact but also to intervene earlier, reducing the risk of costly turnover.
Visual Idea: Improving Quality of Hire – Strategy vs. Outcome Table
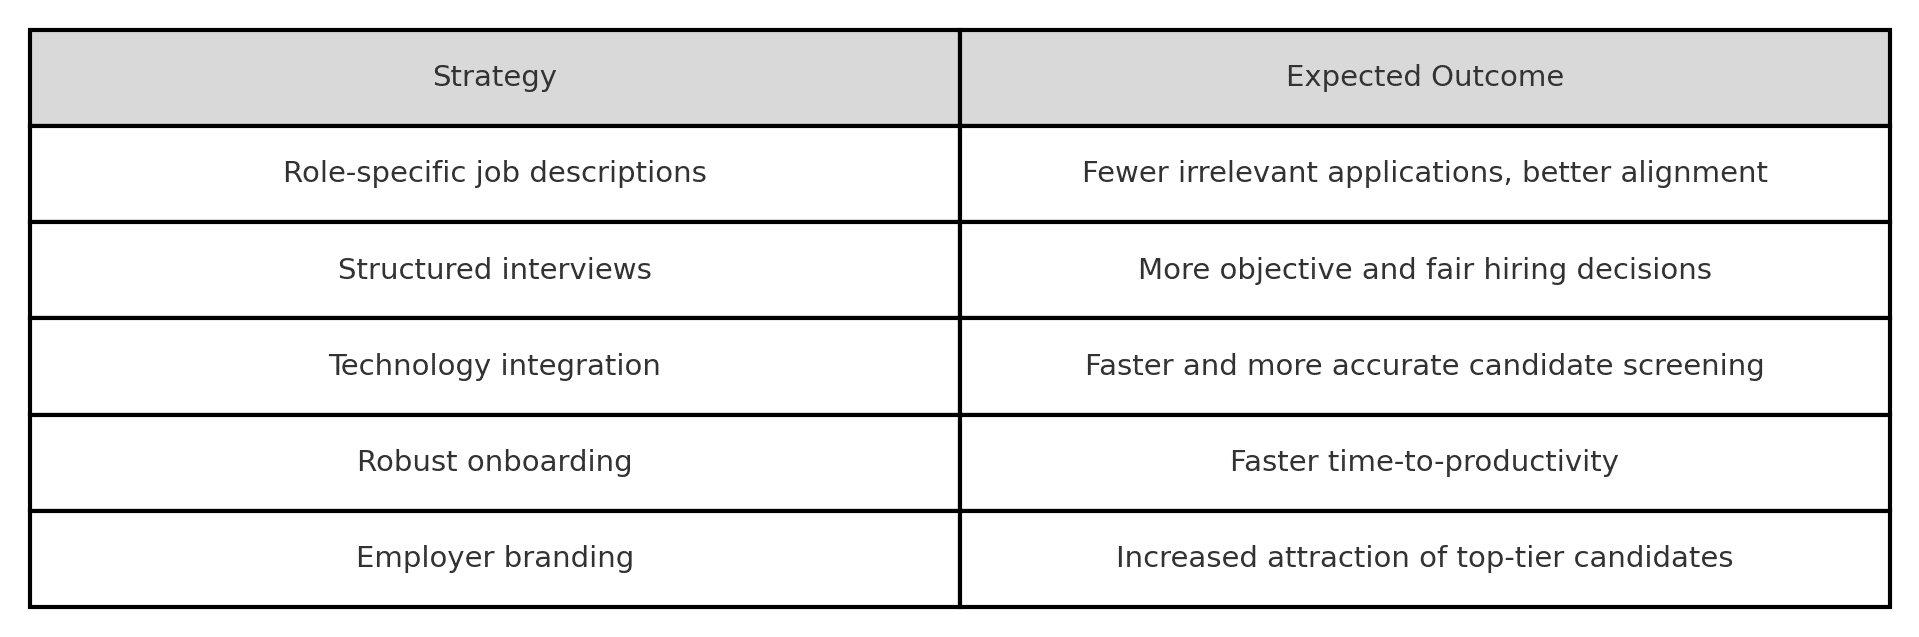
By implementing these strategies, enterprises can systematically improve the quality of hire and ensure their talent aligns with long-term organizational goals.
Conclusion
Measuring quality of hire is more than a recruiting metric. It is a reflection of how well an organization turns its hiring investments into long-term business outcomes. For U.S. enterprises, where the cost of a poor hire can equal nearly a third of that employee’s salary, the stakes are too high to leave success undefined. A structured approach that blends performance data, retention adjusted for value, manager feedback, and cultural alignment gives leaders a consistent framework to evaluate new employees.
The advantage of building this measurement system is twofold. First, it replaces opinion with evidence, helping HR and executives align on what “good hiring” really means. Second, it creates a feedback loop that directly improves future recruiting decisions. With the right formulas, analytics, and predictive models, companies can reduce costly turnover, accelerate ramp-up, and steadily build a workforce that drives sustainable growth.
FAQs
1. What is the most reliable way to calculate quality of hire?
There is no single formula, but a widely used method is to combine performance, cultural fit, retention, and manager satisfaction into a composite score. For example:
Quality of Hire = (Performance + Retention + Cultural Fit + Manager Satisfaction) ÷ 4
This allows organizations to capture multiple dimensions of success instead of relying on a single measure.
2. How often should enterprises measure quality of hire?
The most effective cadence is at 30, 60, and 90 days after onboarding, with a longer review at the one-year mark. The early measurements highlight whether onboarding is working, while the one-year review confirms whether the hire contributed lasting value.
3. Can technology improve quality of hire, or is it just about people’s decisions?
Technology enhances consistency and visibility. Applicant tracking systems help with source analysis, analytics platforms standardize KPIs, and AI models forecast the likelihood of retention. A Harvard Business Review study showed that predictive analytics improved retention by 20% compared to traditional hiring alone.
4. Why not just focus on retention as the main indicator?
Retention on its own is misleading. An underperformer who stays for years is not a high-quality hire, while a high performer who contributes strongly for nine months still adds significant value. This is why many enterprises use quality-adjusted retention formulas that blend tenure with performance.
5. How does quality of hire link to enterprise growth?
Every hire influences productivity, customer experience, and team culture. When quality of hire is consistently measured and improved, companies see faster time-to-market, stronger client delivery, and lower turnover costs. Over time, this creates a talent advantage that directly supports revenue growth and innovation.
