

Most engineering leaders can forecast their cloud spend for the next two quarters within a few percentage points. Ask how many backend engineers they’ll need by March, and the answer is a shrug followed, three months later, by urgent requisitions, inflated counteroffers, and a roadmap slipping one sprint at a time.
That asymmetry is expensive, because hiring is both one of the largest controllable line items in a technology business and one of the most predictable: attrition follows patterns, growth plans are written quarters in advance, and funnel conversion rates barely move month to month.
Closing that gap is what predictive hiring analytics does. It applies the forecasting discipline you already use for revenue, infrastructure, and inventory to your talent pipeline: modeling future demand for roles, predicting where the funnel will break, and starting sourcing before the requisition officially exists. Modern recruitment process outsourcing (RPO) providers have quietly become the biggest operators of this discipline, because forecasting across hundreds of client requisitions generates pattern data no single employer can build alone.
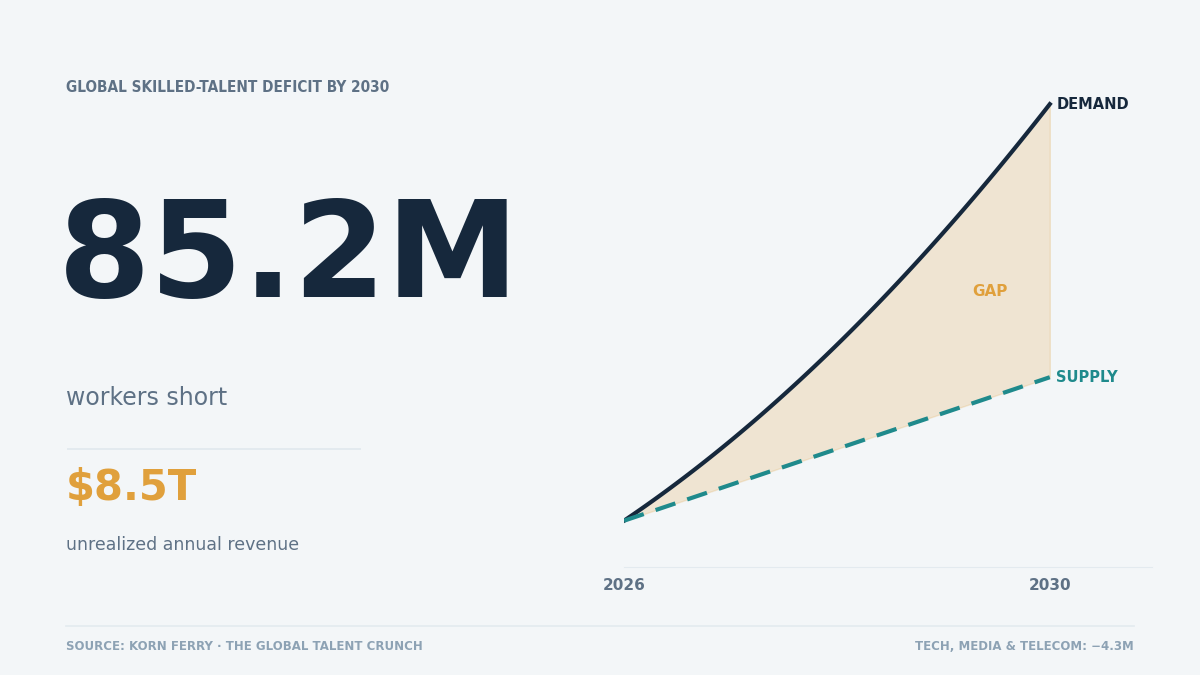
Korn Ferry’s Future of Work: The Global Talent Crunch study projects a global talent deficit of 85.2 million skilled workers by 2030, translating to roughly $8.5 trillion in unrealized annual revenue with technology, media, and telecom facing a 4.3 million-worker shortfall of their own.
In a market that is structurally short of skilled talent, the companies that see demand coming will hire the top candidates weeks before their reactive competitors even open the requisition. This guide is the full playbook for becoming one of those companies.
TL;DR
This guide explains predictive hiring analytics from first principles to a running operation. It is written for CTOs, VPs of Engineering, HR and TA leaders, and founders who are tired of reactive hiring and want to evaluate forecast-led recruiting whether built in-house or run through an RPO partner.
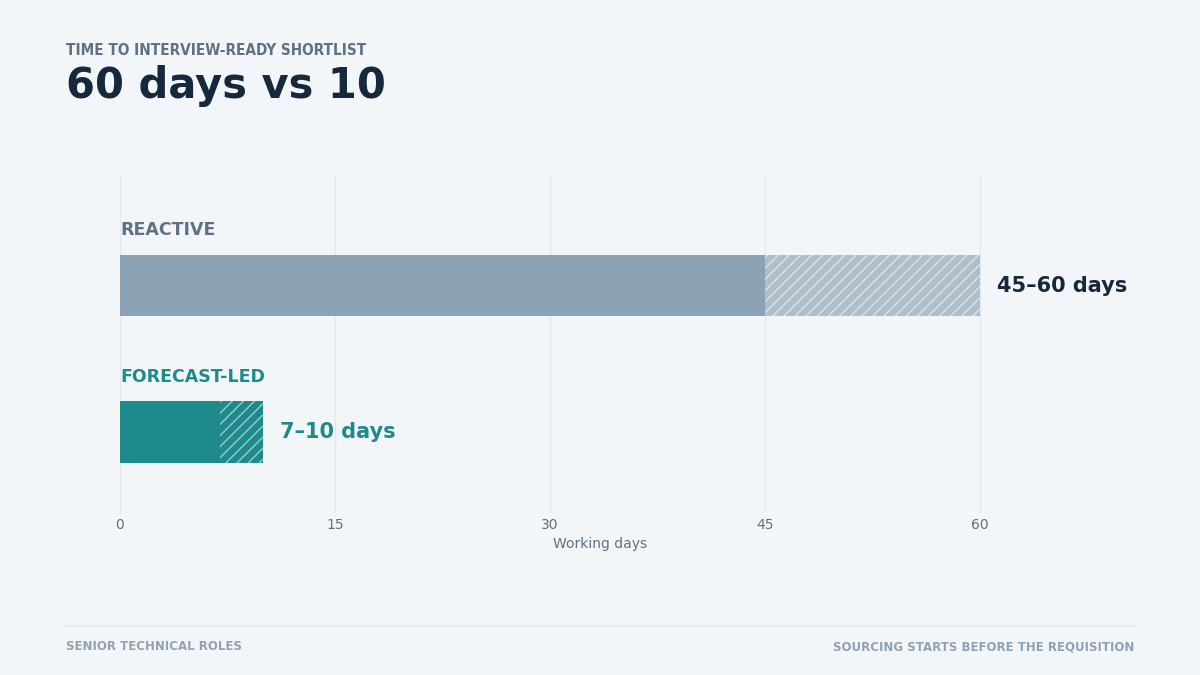
Here is the single most useful number in it: teams that hire reactively typically take 45–60 days to fill a senior technical role, while forecast-led engagements routinely produce interview-ready shortlists in 7–10 working days, because sourcing starts before the requisition does. That difference compounds across every role you open this year.
By the end, you will be able to audit whether your data can support talent demand forecasting, choose between building analytics in-house, buying point tools, or partnering with an RPO, and run the weekly operating cadence that keeps forecasts honest. You will also know exactly what this costs, how long it takes, and the five mistakes that quietly kill most implementations.
What Is Predictive Hiring Analytics?
Predictive hiring analytics is the practice of using historical hiring data, workforce trends, and labor market signals to forecast future talent needs and hiring outcomes predicting which roles will open, when, how hard they will be to fill, and where candidates will come from so sourcing and budgeting start before demand becomes urgent.
That 55-word definition is the whole discipline in one sentence. Just as important is what it is not:
- It is not generic “data-driven recruiting.” Dashboards that report last quarter’s time-to-fill are descriptive analytics and a rearview mirror. Predictive analytics is the windshield: it estimates what happens next and with what probability.
- It is not an ATS report. Applicant tracking systems record what happened inside your funnel. Prediction requires combining that record with attrition models, growth plans, and external labor market intelligence.
- It is not resume-screening AI. Tools that rank applicants for an open role optimize a single decision. Forecasting operates one level up: it tells you the role is coming before anyone has applied.
The distinction matters because most vendors sell descriptive reporting under a predictive label. A simple test: if the output can’t tell you something about a role you haven’t opened yet, it isn’t predictive.
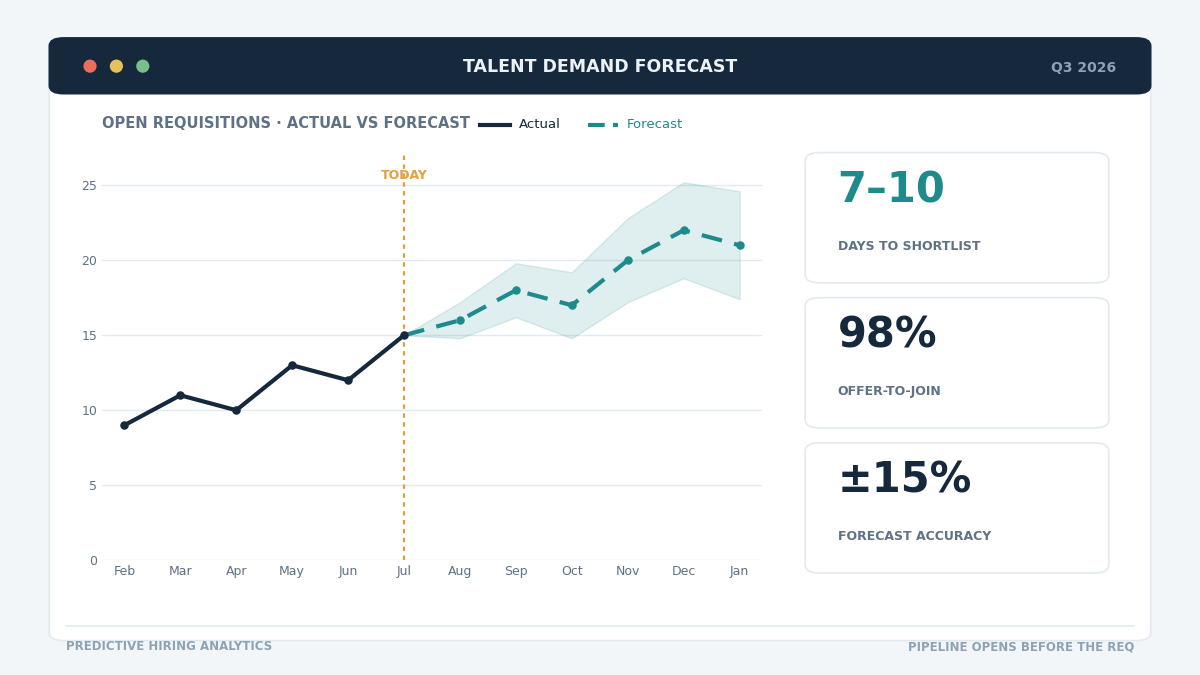
Predictive Recruitment vs. Traditional Recruitment
The operational difference shows up at every stage of the funnel, not just at the start:
- Trigger. Traditional recruiting starts when a requisition opens. Predictive recruiting starts when the probability of a requisition crosses a threshold often 6–10 weeks earlier.
- Pipeline state at day zero. Traditional: empty, cold outreach begins. Predictive: a warm, pre-vetted pool already mapped to the role family.
- Offer stage. Traditional teams discover a candidate’s counteroffer exposure at the finish line. Predictive teams score offer-acceptance probability during screening and prioritize accordingly which is how drop-off rates get held under 1–2% instead of the 10–20% typical for in-demand roles.
- Feedback loop. Traditional recruiting closes the file when the hire starts. Predictive operations feed every outcome except, decline, renege, 90-day performance back into the model, so accuracy compounds quarter over quarter.
Why It Matters: The Business Case for Forecast-Led Hiring
The financial argument is not abstract. Talent demand forecasting changes four line items that every CFO already tracks, and the deltas are large enough to show up in board decks.
What forecast-led hiring concretely moves:
- Speed / time-to-fill. Reactive hiring for senior technical roles commonly runs 45–60 days from requisition to offer. When sourcing begins against a forecast before the requisition is formally opened, vetted shortlists can land in 7–10 working days. Every week saved is a week of roadmap not slipped.
- Cost-per-hire. Panic hiring is expensive: rushed agency fees of 20–30% of CTC, inflated counteroffers, and premium contractor rates to bridge gaps. Forecasted pipelines let you source through cheaper channels on normal timelines, typically cutting fully loaded cost-per-hire by 20–40% in our observed engagements.
- Quality-of-hire. Compressed timelines force compressed vetting. This is the metric the industry admits it can’t see clearly: in LinkedIn’s Future of Recruiting report, 89% of TA professionals say measuring quality of hire will become increasingly important, but only 25% are highly confident they can actually measure it and 61% believe AI/analytics is the fix.
- Risk. Vacancy risk (revenue-generating roles sitting empty), key-person risk (no bench behind a critical engineer), and offer-decline risk (losing 3 weeks to a candidate who was never going to join) are all forecastable and therefore manageable with the right models. Offer-acceptance probability modeling alone can keep candidate drop-off under 1–2% versus industry norms of 10–20% for in-demand roles.
There is also a second-order effect leaders underweight: forecasting changes the conversation with finance. Headcount planning stops being an annual argument and becomes a rolling, evidence-based capacity plan which makes budget approvals faster and hiring freezes more surgical.
The Core Problem: Why Reactive Hiring Keeps Failing
Before the playbook, it’s worth being precise about the failure mode, because the pattern is remarkably consistent across companies of every size.
The reactive hiring doom loop:
- A resignation lands or a roadmap commitment is made. The requisition opens today, but the need existed 8–12 weeks ago you just couldn’t see it.
- Sourcing starts from zero. Pipelines take 2–4 weeks to warm up for niche skills (DevOps, ML, staff-level backend), during which nothing visible happens and pressure builds.
- Vetting gets compressed. Interview loops that should take 10 days get squeezed into 4, screening rigor drops, and mis-hire probability climbs.
- The offer stage becomes a bidding war. In-demand candidates hold 2–3 competing offers; teams without pipeline depth overpay by 15–25% or lose the candidate entirely.
- The vacancy drags, the team burns out covering the gap, and the next resignation becomes more likely restarting the loop.
The underestimation problem: most teams underestimate true fill timelines by 3–4x. Leaders budget “a month” for a role that historically takes 90+ days when you count the invisible pre-requisition lag the weeks between when the need actually materialized and when anyone acted on it. Workforce forecasting exists precisely to eliminate that invisible lag, because it is the only part of the timeline that costs nothing to remove.
Red flag: if your TA team can’t tell you next quarter’s expected requisition count within ±20%, you are running reactively by default regardless of how many dashboards you own.
The Complete Walkthrough: From Zero to a Running Forecast Operation
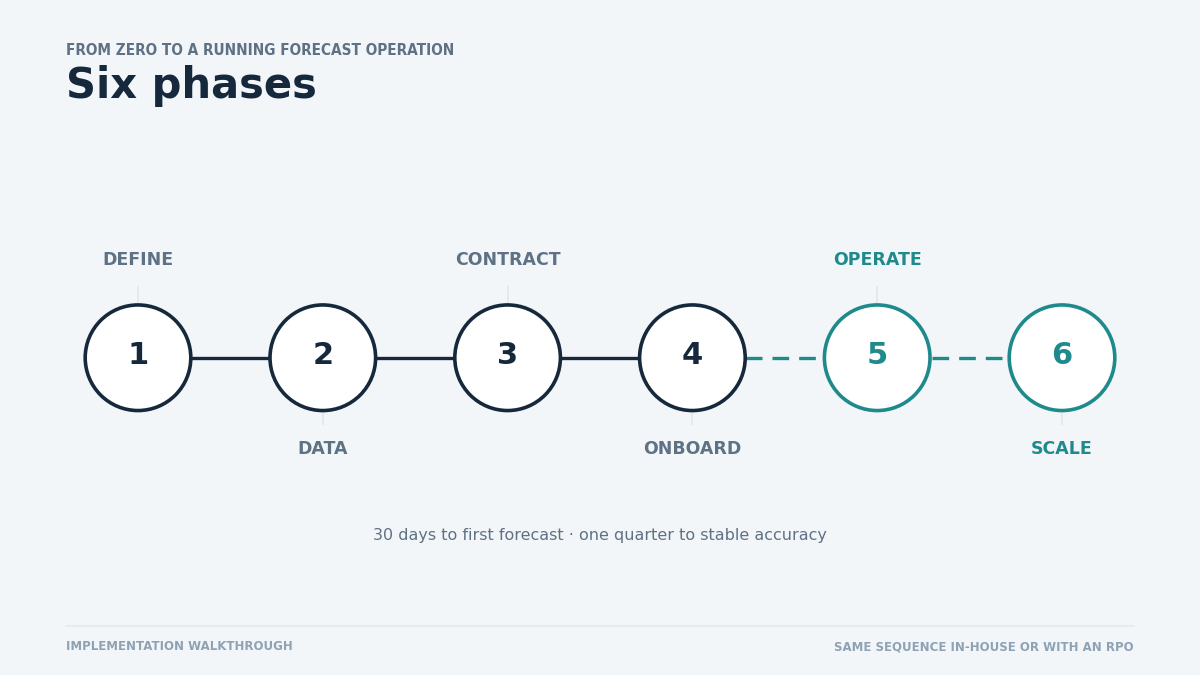
This is the section to bookmark. It covers the entire lifecycle of moving to predictive recruitment from deciding you need it to running it at scale in six phases. A reader starting from scratch can execute this end to end.
Where an RPO partner is involved, we’ve noted exactly what to demand of them at each phase; the sequence is identical if you build in-house.
Phase 1 Defining Requirements: Scope, Horizon, and Budget
Every failed analytics initiative we’ve seen died in this phase, usually by skipping it. Before touching data or vendors, lock four decisions:
- Forecast scope. Which roles are in-scope for prediction? Start narrow: the 3–5 role families that are either highest-volume (e.g., backend, QA) or highest-pain (e.g., DevOps, data engineering). Whole-company forecasting on day one is how projects stall for six months.
- Forecast horizon. For most tech companies the useful horizon is 3–6 months. Shorter than 8 weeks and you’re not forecasting, you’re reacting with extra steps; longer than 9 months and model accuracy degrades below usefulness for anything except annual headcount planning.
- Decision linkage. Name the specific decisions the forecast will drive: when to open requisitions, when to pre-build pipelines, when to brief finance. A forecast nobody is contractually obliged to act on is a slide, not a system.
- Budget band. Set the envelope now, because it determines the build-vs-partner decision in Phase 3. Realistic annual bands: ₹8–15 lakhs (~$10k–18k) for point tools only; ₹60 lakhs–1.2 crore (~$75k–150k) for a minimal in-house analytics pod; RPO engagements vary by volume but typically price per-hire or as a monthly management fee (detailed ranges in the Cost & Timeline section).
The one-page requirement doc: scope roles, horizon, the 3 decisions the forecast drives, the accuracy threshold you’ll accept (e.g., ±15% on quarterly requisition volume), and the budget band. If it doesn’t fit on one page, the scope is too big.
Phase 2 The Data Foundation: What a Forecast Actually Eats
This is the phase where “what data do you need for workforce forecasting” gets a concrete answer. Prediction quality is capped by data quality, and most organizations discover their hiring data is messier than expected.
Minimum viable dataset (the non-negotiables):
- 18–24 months of ATS history: requisitions opened/closed, stage-by-stage funnel conversion rates, time-in-stage, source of hire, offer-accept/decline outcomes with reasons.
- HRIS records: joins, exits with exit reasons, internal transfers, tenure at exit this feeds attrition modeling, which typically drives 40–60% of total hiring demand in steady-state companies.
- The growth plan: approved headcount plans, product roadmap milestones, and funding/revenue triggers. Demand forecasting without the business plan is just attrition math.
- External labor market intelligence: supply/demand ratios for target skills, compensation benchmarks by city and level, competitor hiring velocity. This is the layer almost no in-house team has and the layer RPO providers bring by default, because they observe it across dozens of concurrent clients.
Signals that separate good models from decorative ones:
- Seasonality curves (appraisal-cycle attrition spikes in Q1/Q2 in India; hiring slowdowns around fiscal year-ends)
- Offer-acceptance probability by candidate segment, notice-period length, and counteroffer exposure
- Recruiter-to-requisition ratios and per-recruiter capacity, so the forecast produces a staffing plan, not just a demand number
- Skills taxonomy consistency “SDE-2,” “Backend Engineer II,” and “Senior Developer” must resolve to one entity or every downstream number is noise
Red flag: a vendor or internal team that promises forecasts without asking for your exit data. Attrition is the largest single demand driver; anyone ignoring it is selling astrology.
On team shape: if you build this in-house, the minimum pod is one analytics-literal TA ops lead plus access to data talent. Many companies choose to hire data scientists on a contract basis for the initial model build, then hire machine learning engineers only if they later productionize custom models full-time ML headcount on day one is premature for 90% of companies.
Phase 3 Engagement Models & Contracts: Build, Buy, or Partner
Three viable paths exist, and the honest answer is that they suit different companies rather than one being universally superior.
- Build in-house. Full control and institutional learning, but 6–9 months to first reliable forecast, ₹60 lakhs–1.2 crore/year in team cost, and a cold-start problem: your models learn only from your own history, which for a 200-person company is a thin dataset.
- Buy point tools. Workforce planning and TA analytics SaaS gets you dashboards in 4–8 weeks at ₹8–15 lakhs/year. The catch: tools model your internal data well but are weak on external supply signals, and someone still has to act on the forecast. A tool opens no pipelines.
- Partner with an analytics-driven RPO. The provider runs forecasting and the execution it triggers: when the model says three backend roles are coming in Q3, sourcing starts in Q2. Cross-client pattern data solves the cold-start problem, and accountability sits with an SLA rather than a dashboard. Evaluate providers’ RPO services specifically on their forecasting artifacts to see a real (anonymized) demand forecast and its accuracy review from an existing client.
Contract terms that matter more than price:
- Data ownership and DPA: your hiring data remains yours; the provider’s data processing agreement must survive termination with deletion/return obligations.
- Model transparency: you don’t need the algorithm’s source code, but you’re entitled to know the input factors and to receive forecast-vs-actual accuracy reports.
- NDA and IP protection covering your org design and growth plans a demand forecast is competitively sensitive information.
- Replacement guarantees: forecast-led hiring should be confident enough to warrant one. A 7–10 day replacement window on mis-fit hires is a reasonable market standard to demand.
- Exit and portability clauses: forecasts, dashboards, and documented models should be handed over on exit (more in Phase 6).
Green flags when evaluating partners: dedicated development teams, a written forecast-accuracy review from a live client, published funnel benchmarks for your role families, and willingness to run a 1-quarter pilot scoped to your 2–3 hardest role families before any long-term commitment.
Phase 4 Onboarding & Ramp-Up: The First 30 Days
Whether in-house or partnered, the ramp follows the same arc. Here’s the realistic first month:
- Week 1 Access and audit. ATS/HRIS read access granted, historical data extracted, quality audit run. Expect the audit to find gaps (missing exit reasons, inconsistent role titles); budget 3–5 days to patch the worst of them.
- Week 2 Baseline models. Attrition baseline and funnel conversion baselines built per role family. Stakeholder interviews with engineering leads to encode the growth plan.
- Weeks 3–4 First forecast and calibration. A 90-day demand forecast is produced, reviewed against leadership’s intuition, and critically the disagreements are investigated. Half the value of the first forecast is surfacing plans that exist in someone’s head but nowhere in a system.
Onboarding friction to expect (from real engagements): the single most common blocker is not technology; it’s that hiring managers’ informal “shadow plans” (roles they intend to request but haven’t) are invisible to every system. Institute a 15-minute monthly “intent capture” with each team lead; it improves 90-day forecast accuracy more than any modeling change.
Communication cadence to lock before week 2 ends: a named account manager or analytics owner (never shared bandwidth across accounts), a weekly 30-minute pipeline-vs-forecast review, and a monthly accuracy retrospective.
Phase 5 Managing Delivery: The Operating Cadence and KPIs
A forecast is only as good as the operating rhythm around it. This is where hiring analytics stops being a project and becomes infrastructure.
The weekly review (30 minutes, non-negotiable agenda):
- Forecast vs. actual: requisitions opened this week against predicted
- Pipeline health: candidates in-process per forecasted-but-unopened role
- Exceptions: surprise requisitions (why did the model miss them?) and stalled roles
- Next 2 weeks: which pre-emptive sourcing starts now
KPIs that actually indicate the system works:
- Forecast accuracy: quarterly requisition volume within ±15% (a mature operation reaches ±10%); track MAPE per role family, not just in aggregate
- Pre-emptive coverage: % of new requisitions that open with a warm pipeline already attached the single best health metric; 60%+ is strong
- Time-to-shortlist: 7–10 working days from requisition to interview-ready candidates for covered roles
- Joining rate and drop-off: offer-to-join conversion of 95%+ and candidate drop-off under 2% indicate the offer-probability models are working
- Cost-per-hire trend: should decline 15–30% over the first year as panic-channel spend disappears
The 3-day rule: any variance between forecast and reality that persists for two consecutive weekly reviews gets a root-cause analysis within 3 days. Models drift; the discipline of investigating drift is what keeps them alive.
The four-stage maturity ladder (know where you are):
- Descriptive you can report last quarter’s time-to-fill and source mix accurately. Necessary, not sufficient.
- Diagnostic you can explain why metrics moved (channel decay, comp-band mismatch, a slow interview stage).
- Predictive you forecast requisition volume, fill difficulty, and offer outcomes with tracked accuracy. This is the stage this guide gets you to.
- Prescriptive the system recommends actions (open the req now, shift budget to channel X, pre-brief this passive pool) and you A/B test its recommendations. Most organizations genuinely operating here are large RPO providers and a handful of big-tech TA teams; treat any vendor claiming it casually with suspicion.
Phase 6 Scaling or Exiting: Expanding Scope and Protecting Yourself
After 2–3 quarters of stable accuracy, the roadmap forks into scaling moves and exit hygiene.
Scaling moves, in the order that usually pays off:
- Widen role coverage from the initial 3–5 families to the full technical org
- Extend the horizon from 90 days to 6 months for strategic roles
- Add attrition risk scoring (who is likely to leave, not just how many) with explicit ethics guardrails and HR-only visibility
- Feed the forecast into location strategy: at sustained volumes of 30+ technical hires/year in a market, the same demand models justify evaluating a GCC or offshore pod rather than one-by-one hiring
Exit hygiene (decide this before you need it):
- Forecast models, assumptions, and accuracy history are documented and handed over
- Pipelines and candidate relationships transfer to you, not the provider’s next client
- A 60–90 day transition period with overlapping coverage, so requisitions in flight don’t drop
- Replacement obligations on recent hires survive the contract end date
Red flag: a partner who resists documenting how forecasts are produced. Vendor lock-in through opacity is the oldest trick in analytics services.
Case Studies: Forecast-Led Hiring in the Wild
Three engagements from Supersourcing’s delivery portfolio that show what the playbook above looks like when it ships. Metrics first, story second.
100+ engineers, one predictable pipeline Paytm. Scaling an engineering org by 100+ hires is exactly the scenario where reactive recruiting collapses: at that volume, even small funnel inefficiencies compound into months of delay. Running the engagement forecast-first modeling requisition flow by role family and pre-building pipelines against the plan rather than against individual openings kept shortlist delivery inside the 7–10 working-day window across the program and sustained a 98% offer-to-join rate, versus the 10–20% drop-off that high-demand fintech roles typically suffer.
Hyper-growth without hiring chaos Swiggy. Food-delivery scale-ups face brutal demand volatility: hiring needs swing with funding cycles, city launches, and seasonal order spikes. The forecast layer here earned its keep less through raw speed and more through timing mapping hiring waves to expansion milestones so pipelines warmed 4–6 weeks ahead of each wave, and engineering leads spent interview hours on pre-vetted top-2% shortlists instead of raw applicant pools.
Recruitment automation as the product Somnoware. A healthtech company with lean internal TA capacity used an outsourced, analytics-instrumented recruiting operation to compress its hiring cycle for specialized engineering roles the classic case where recruitment process outsourcing beats an in-house build: the volume didn’t justify a dedicated analytics pod, but the roles were too specialized for spray-and-pray sourcing. Funnel instrumentation and demand forecasting came bundled with execution, at a per-hire cost instead of a fixed team cost.
The common thread: none of these outcomes came from a smarter interview question. They came from starting the pipeline before the requisition existed.
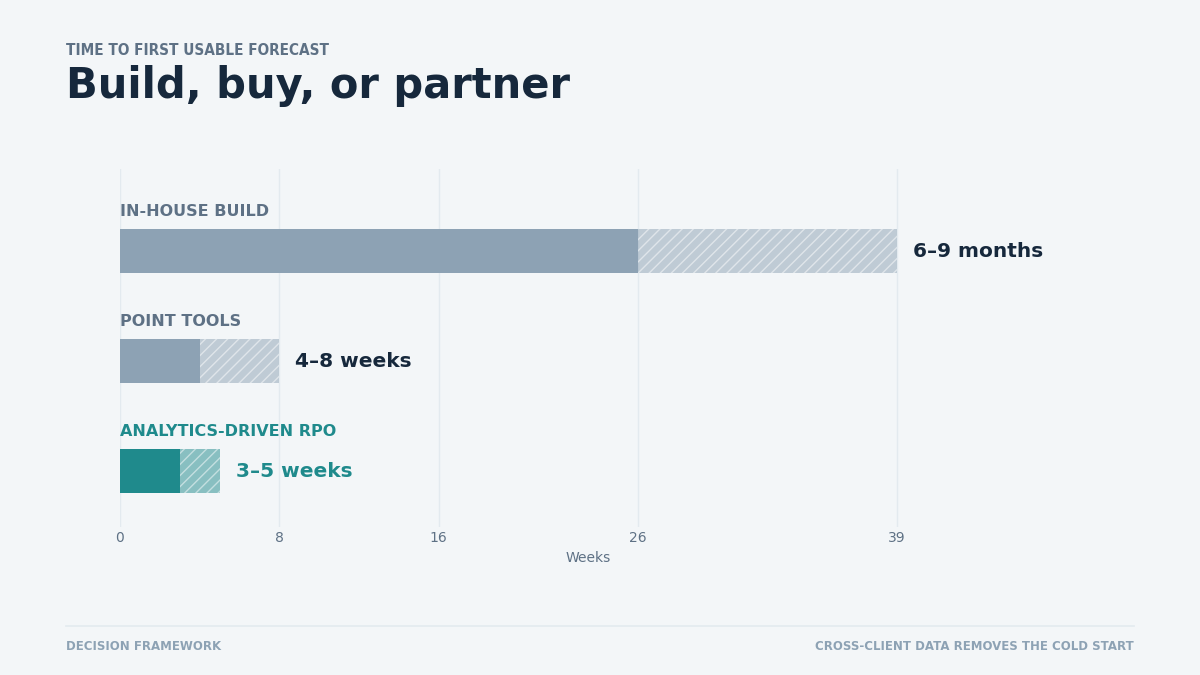
Decision Framework: In-House vs. Tools vs. Analytics-Driven RPO
Use this to place your company on the map. The honest comparison across the four realistic options:
| Dimension | In-house analytics team | Point-solution tools | Traditional agency | Analytics-driven RPO |
| Time to first forecast | 6–9 months | 4–8 weeks (internal data only) | Never reactive by design | 3–5 weeks |
| Annual cost order-of-magnitude | ₹60L–1.2Cr (~$75k–150k) team cost | ₹8–15L (~$10k–18k) licenses | 15–30% of CTC per hire, no forecasting | Per-hire or monthly fee; typically 30–50% below agency at volume |
| External market signal | Weak (own data only) | Weak-to-moderate | Anecdotal | Strong (cross-client pattern data) |
| Who acts on the forecast | You | You | N/A | The provider, under SLA |
| Control & institutional learning | Highest | Medium | Low | Medium-high (if handover clauses exist) |
| Best fit | 500+ employees, 100+ hires/yr | Companies with strong TA ops wanting visibility | One-off niche searches | 15–100+ tech hires/yr without an analytics pod |
How RPO Providers Forecast Hiring Needs (and Why It’s Hard to Replicate)
The structural advantage of an analytics-driven RPO isn’t smarter mathematics, it’s the dataset. A provider running requisitions across dozens of clients in the same talent markets observes things a single employer never can:
- Live supply-side signals: how many qualified Golang or DevOps candidates actually entered the market this month, at what compensation expectations, with what notice periods refreshed from active pipelines rather than stale salary surveys.
- Cross-client seasonality: appraisal-cycle attrition waves, post-funding hiring surges, and quarter-end slowdowns show up in aggregate weeks before any single client feels them.
- Benchmark funnels: knowing that a comparable fintech converts 12% of screened candidates to offer for a given role family turns your 6% into a diagnosable problem instead of an accepted fact.
- Offer-behavior priors: thousands of historical accept/decline outcomes make offer-acceptance probability models meaningfully accurate from week one, instead of after a year of your own data collection.
This is why the build-vs-partner decision is really a data decision. An in-house team can match the modeling in a quarter; matching the dataset takes years of volume you may never have.
Three-question shortcut:
- Will you make 100+ hires a year for the next 3 years? If yes, start building in-house and use a partner for the interim; the handover clauses in Phase 3 make this a sequenced strategy, not a binary choice.
- Do you have anyone who will own forecast accuracy as a KPI? If not, tools alone will become shelfware; buy execution, not dashboards.
- Is your pain concentrated in 2–3 hard role families rather than volume? Then scope an RPO engagement to exactly those families and keep the rest in-house.
What Most Teams Get Wrong About Predictive Hiring
Patterns from watching implementations succeed and fail. These are the opinions most guides are too polite to print.
They buy predictions and keep reacting. The most common failure isn’t model accuracy, it’s organizational. The forecast says three DevOps roles are coming in Q3, and leadership still waits for the resignation letter to approve sourcing. A forecast without a pre-commitment to act on it (“at 70% probability, pipeline-building auto-starts”) is expensive decoration.
They over-invest in modeling and under-invest in data hygiene. Teams debate machine learning models for weeks while their ATS has three names for the same job title and no exit reasons recorded. A regression model on clean data beats a neural network on garbage, every time, and the industry keeps relearning this in public.
They demand oracle-level accuracy before acting. Executives dismiss a forecast that’s ±15% as “just a guess.” Meanwhile their current implicit forecast zero preparation is ±100%. The bar isn’t perfection; it’s beating the status quo, and the status quo is very, very low.
They forecast demand but not supply. Knowing you’ll need five ML engineers in Q2 is half the picture; the other half is that your target market produces perhaps thirty qualified-and-movable ones per quarter at your compensation band. Talent pipeline forecasting has to model both sides, or you’ll predict your way into the same bidding wars, just earlier.
They treat attrition prediction as a surveillance tool. Attrition risk scoring points at individuals, visible to line managers, poisons trust and eventually the data itself. Keep individual-level signals restricted to HR, use aggregate risk for capacity planning, and audit models for bias on protected attributes quarterly both because it’s right and because regulators are moving this way.
They confuse a fast agency with a predictive one. Speed on an open requisition can be brute-forced with recruiter hours. The test of genuinely predictive recruitment is different: ask any vendor what percentage of their placements came from pipelines built before the client opened the requisition. Silence answers the question.
Cost & Timeline Reality Check
The section competing articles skip, in numbers. All figures are typical market ranges, not quotes; your volume, role mix, and location strategy move them.
Implementation timelines by path:
| Scenario | First usable forecast | Stable ±15% accuracy | Full ROI visibility |
| Point tools on clean data | 4–8 weeks | 4–6 months | 6–9 months |
| Point tools on messy data | 3–4 months | 6–9 months | 9–12 months |
| In-house build | 6–9 months | 9–15 months | 12–18 months |
| Analytics-driven RPO | 3–5 weeks | 3–5 months | ~2 quarters |
What things cost (annualized, typical ranges):
- TA analytics / workforce planning SaaS: ₹8–15 lakhs (~$10k–18k) for mid-market tiers; enterprise tiers 2–4x that
- Minimal in-house pod (TA ops lead + fractional data science): ₹60 lakhs–1.2 crore (~$75k–150k) fully loaded
- Traditional contingency agency: 15–30% of annual CTC per hire on a ₹40 lakh engineer, that’s ₹6–12 lakhs per head, with zero forecasting included
- RPO engagement: per-hire fees or monthly management fees that, at 15+ hires/year, typically land 30–50% below equivalent agency spend with forecasting, funnel instrumentation, and dedicated account management bundled rather than billed separately
What drives cost up: niche skill families (LLM/GenAI, staff-level platform engineering), multi-country hiring, poor data requiring remediation, and the silent one internal indecision that keeps pipelines warm but unconverted.
What drives cost down: concentrated role families (volume in fewer skills), 18+ months of clean ATS history, a single decision-maker per requisition, and honesty about compensation bands before sourcing starts rather than after offers bounce.
The ROI math worth running: take your last 10 senior hires, count actual days from need identified (not req opened) to start date, multiply the gap beyond 30 days by the role’s daily revenue or delivery impact. For most tech companies that number, per role, exceeds the entire annual cost of the forecasting capability.
Next Step: Pressure-Test Your Hiring Forecast
If you’ve read this far, you’re likely mid-decision somewhere between “our hiring is too reactive” and “who should fix it.” The lowest-risk next move isn’t a contract; it’s a calibration.
Bring your last two quarters of hiring data and your next two quarters of growth plans to a working session with Supersourcing’s RPO team. You’ll leave with three concrete things: a data-readiness verdict (can your ATS/HRIS history support forecasting today), a realistic demand estimate for your next quarter, and a build-vs-partner recommendation you can defend to finance including the case where the honest answer is “build it in-house.”
No deck, no drawn-out sales cycle. One session, your data, a defensible plan: https://supersourcing.com/contact-us/
FAQ: Predictive Hiring Analytics
How does predictive hiring analytics work in practice?
Historical hiring data (funnel conversions, time-in-stage, attrition), business plans (roadmaps, approved headcount), and external labor market signals are combined in statistical or machine learning models that output role-level demand forecasts, fill-difficulty estimates, and offer-acceptance probabilities. Recruiters then act on the forecast building pipelines before requisitions open and forecast-vs-actual reviews retrain the models monthly.
How is predictive recruitment different from data-driven recruiting?
Data-driven recruiting usually means descriptive reporting: dashboards on what already happened. Predictive recruitment estimates what happens next, which roles open, which searches will be hard, which offers will be declined early enough to change the outcome. The practical test: descriptive analytics can’t tell you anything about a role you haven’t opened yet; predictive analytics exists precisely to do that.
How accurate is talent demand forecasting, really?
On 18+ months of clean data, quarterly requisition-volume forecasts within ±15% are a realistic expectation, improving toward ±10% after two or three calibration cycles. Accuracy is lower for brand-new role families and for horizons beyond 6–9 months. The right comparison isn’t perfection, it’s the ±100% uncertainty of no forecast at all.
Can startups and mid-size companies use workforce forecasting?
Yes, with a caveat: below roughly 10–15 hires a year, your own data is too thin to model, so the leverage comes from a partner’s cross-client data rather than an in-house build. From about 15 hires/year upward, forecast-led hiring through an RPO or well-run tools reliably beats reactive recruiting on both speed and cost-per-hire.
Does predictive hiring introduce bias?
It can reproduce models trained on biased historical decisions. Mitigations are well-established: exclude protected attributes and their proxies from features, audit outcomes by demographic quarterly, keep individual attrition-risk scores restricted to HR, and require model-transparency clauses from any vendor. Done properly, structured forecasting typically reduces bias versus deadline-panicked human shortcuts.
How long does implementation take?
Through a partner: first forecast in 3–5 weeks, stable accuracy in 3–5 months. With point tools: 4–8 weeks to dashboards if your data is clean, 3–4 months if it isn’t. In-house builds run 6–9 months to a first reliable forecast. The single biggest schedule variable is ATS/HRIS data quality, not technology.
How do I evaluate whether an RPO provider genuinely forecasts, or just reports?
Ask for three artifacts from live engagements: an anonymized demand forecast, its forecast-vs-actual accuracy review, and the percentage of placements sourced from pipelines built before the requisition opened. Providers doing this for real produce them within a day. If you’d like a benchmark of what those artifacts should look like for your hiring volume, a 30-minute consultation with a forecasting-led team will calibrate expectations quickly.
What’s the fastest first step if I’m mid-decision right now?
Run the Phase 1 exercise from this guide: one page with scope roles, horizon, the decisions the forecast will drive, and a budget band. Then pull your last 12 months of requisitions and check whether anyone could have predicted 70% of them from attrition patterns plus the roadmap. Almost always, the answer is yes which tells you the constraint was never predictability. It was a process.
