

Two companies sign identical RPO contracts. Twelve months later, one CFO renews at double the scope; the other kills the program. Same vendor tier, same fee structure, same market. The difference wasn’t the vendor, it was the metric. The first company measured RPO cost per quality hire. The second measured plain cost per hire, watched it drop 18%, and still couldn’t explain why engineering velocity hadn’t moved.
That’s the trap with cost-per-hire as an ROI metric: it rewards cheap hiring, not good hiring. A recruiter who fills a seat in 20 days with a candidate who quits in month five looks great on a CPH dashboard. The damage shows up two quarters later, in a different spreadsheet, owned by a different team so nobody connects it back to the hiring decision.
LinkedIn’s Future of Recruiting research now measures quality of hire as a blend of demand, retention, and internal mobility and reports that 61% of talent acquisition professionals believe AI will improve how quality of hire is measured. Quality, not volume, is becoming the axis the industry benchmarks itself on.
The fix is a single blended metric: divide what you spend on recruiting not by hires made, but by hires that were worth making. This guide builds that metric from scratch the formula, the weights, the data fields, the contract clauses that make an RPO partner accountable to it, and the honest timeline before the number means anything. By the end, you’ll be able to put a defensible ROI figure in front of a CFO and know exactly which levers move it.
TL;DR
This guide is for talent, finance, and engineering leaders who need to prove or disprove that a recruitment process outsourcing investment is paying off. It walks through building an appropriate cost per quality hire model from zero: defining quality, building the cost baseline, blending them into one number, and wiring that number into the contract.
The single biggest finding from running this model across real engagements: most teams overstate their true hiring ROI by roughly 2x, because 30–45% of their "successful" hires fail a basic 12-month quality gate and plain cost per quality hire math exposes that instantly.
Finish the guide and you'll be able to calculate your current quality-adjusted hiring cost in about two weeks, benchmark an RPO proposal against it, and know at exactly which month a fair verdict on the engagement becomes possible.
What Is RPO Cost Per Quality Hire?
RPO cost per quality hire is the total cost of a recruitment process outsourcing engagement fees, internal support time, and tooling divided by the number of hires who pass a predefined quality gate (typically 12-month retention plus an on-target performance rating). It measures what each successful hire costs, not each hire.
What it is not:
- Not cost per hire. CPH counts every hire, including the ones who wash out in 90 days. This metric only counts hires that cleared the quality bar.
- Not a quality-of-hire survey score. QoH scores rate hires; this metric prices them.
- Not the RPO vendor’s fee per placement. Vendor fees are one input. The metric includes your internal costs of running the engagement too.
Why It Matters: The Business Case for Measuring Quality, Not Volume
The case for switching metrics is arithmetic, not philosophy. Consider what each blind spot costs:
- Bad hires are invisible in CPH. SHRM pegs average recruiting cost near $4,700 per hire, but notes employers estimate the true cost of filling a role at 3–4x the position’s salary once ramp and productivity loss are counted. A $9,000-CPH “win” that produces a mis-hire in a ₹35 lakh ($42k) role isn’t a win.
- Turnover is the largest unpriced line item in hiring. Gallup estimates voluntary turnover costs U.S. businesses about $1 trillion annually, with replacement costs running one-half to two times the employee’s annual salary. Every early exit silently doubles or triples the real cost of that requisition.
- RPO decisions get made on the wrong axis. RPO vendors routinely win or lose renewals on time-to-fill and fee-per-hire. Both metrics can improve while quality degrades faster, cheaper, worse is a real and common outcome.
- Finance trusts blended metrics. A quality-gated cost number reads like a unit economic CAC for talent. It survives CFO scrutiny in a way that “hiring manager satisfaction is up” never will.
- It changes vendor behavior. The moment an RPO partner’s scorecard includes 12-month survival of their hires, screening rigor goes up. Incentives do the work that escalation meetings can’t.
The one-line business case: if 35% of your hires fail a quality gate, your real hiring cost is ~1.5x whatever your dashboard says and no amount of CPH optimization fixes that.
The Core Problem: Why Most Teams Can’t Answer “Is Our RPO Working?”
Ask a talent leader mid-engagement whether their RPO is delivering ROI and you’ll usually get time-to-fill charts. Ask their CFO and you’ll get a shrug. The gap has four specific causes, and they compound:
- Quality data lives in systems recruiting can’t see. Retention sits in the HRIS. Performance ratings sit in the performance tool. Recruiting costs sit in the ATS and in finance. In most mid-size companies, nobody has ever joined these three tables. The model in this guide is, at its core, a three-table join.
- Teams undercount internal costs by 30–50%. Hiring manager interview hours, coordinator time, referral bonuses, employer-brand spend, and ATS licenses rarely make it into the CPH denominator’s twin. The SHRM/ANSI cost-per-hire standard requires internal and external costs; most homegrown calculations quietly drop the internal half.
- The quality window outlasts the review cycle. A 12-month retention gate can’t be evaluated at the 6-month QBR. Teams either judge the RPO too early on incomplete data, or skip quality entirely and fall back to speed metrics. Both paths end in a renewal decision made on vibes.
- No baseline was captured before the engagement started. The most common structural failure: teams sign the RPO contract, then wonder what in-house performance looked like. Without a pre-engagement baseline, even a rough one from two quarters of historical data, every ROI claim is unfalsifiable.
Red flag: if your current hiring reports can’t tell you what percentage of last year’s hires are still employed and rated on-target today, you don’t have a measurement problem. You have a data-plumbing problem, and Phase 1 below is where you fix it.
The Walkthrough: Building an RPO ROI Model From Scratch to Boardroom
Everything below assumes nothing. The pro roi model you’ll have at the end takes roughly 2–4 weeks to build, one to two quarters of historical data to baseline, and produces its first fully defensible verdict 12–15 months into an engagement with credible leading indicators from month 3. Six phases, in strict order; skipping Phase 1 or Phase 4 is where most models die.
Phase 1 Define Quality of Hire Before Anyone Argues About Cost
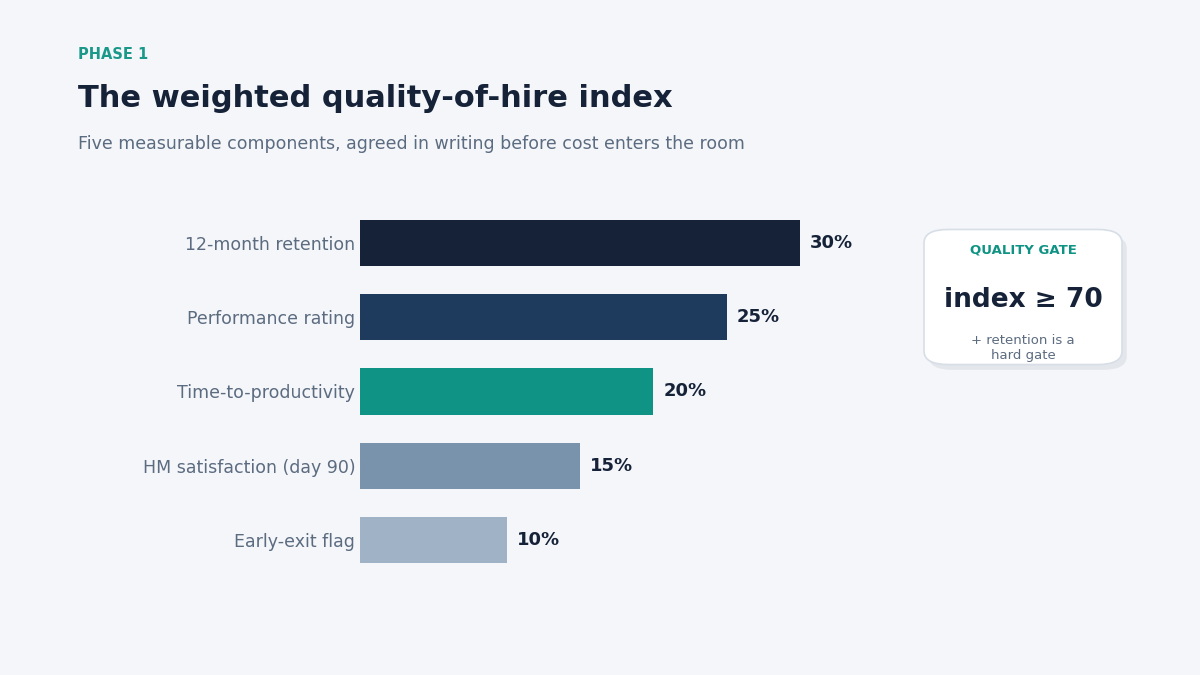
Quality of hire is only vague if you let every stakeholder define it in their head. Pin it to 4–5 measurable components with weights, agreed in writing, before any cost data enters the room. The quality of hire metrics that survive contact with real ATS/HRIS data are the boring ones:
A weighted quality index that works for tech hiring:
- 12-month retention still employed, not on a PIP weight 30%
- First-cycle performance rating meets or exceeds expectations weight 25%
- Time-to-productivity hit an agreed ramp milestone (first solo production deploy, first closed project) within target weight 20%
- Hiring manager satisfaction at day 90 score ≥4/5 on a two-question survey weight 15%
- Early-exit flag no resignation or termination inside 6 months weight 10%
Each hire scores 0–100 on the index. Then set the quality gate: the threshold a hire must cross to count as a “quality hire.” A common, defensible gate is index ≥70 and the retention component satisfied retention is a hard gate, not a tradeable one, because a brilliant hire who leaves in month seven returned almost nothing.
Data fields you must be able to pull, per hire:
- Requisition ID, role, level, start date (ATS)
- Employment status + termination date/reason if any (HRIS)
- First performance rating + date (performance tool)
- Ramp milestone date (engineering/project tracker, or manager attestation)
- 90-day HM survey score (a two-question form; don’t overbuild this)
The 5-day rule: if pulling these five fields for last year’s hires takes your team more than five working days, fix the pipeline before proceeding. A quality model on top of broken joins produces confident nonsense.
Red flag: more than 6 components, or any component nobody currently tracks (“culture contribution score”). Untracked components become permanently-blank columns that quietly kill the model’s credibility.
Phase 2 Build the True Cost Baseline (the SHRM/ANSI Way, Then Some)
Now the denominator’s sibling: total recruiting cost. Use the SHRM/ANSI structure internal plus external costs over the measurement period and resist the urge to trim “soft” lines. The soft lines are where the 30–50% undercount hides.
External costs (usually well-tracked):
- Agency and contingency fees (typically 15–25% of annual CTC per placement for tech roles in India this line alone often justifies the whole exercise)
- Job board, sourcing-tool, and assessment-platform spend
- Background verification, relocation, signing bonuses
- Employer-brand and recruitment-marketing spend attributable to the period
Internal costs (usually invisible):
- Fully loaded recruiter and coordinator compensation, prorated to hiring work (an in-house tech recruiter in India typically runs ₹8–18 lakh/year fully loaded; $70k–110k in the US)
- Hiring manager and panel interview hours × loaded hourly rate for a typical engineering hire with 5 interviews across 4 panelists, this is 12–20 engineer-hours per hire, more per offer once declines are counted
- Referral bonuses actually paid
- ATS/HRIS licence share
Say you’re staffing a backend team and the funnel shows what most tech funnels show roughly 100 applicants → 12 screens → 5 onsites → 1.5 offers → 1 join. Price that whole funnel, not just the join. This is also where role economics diverge sharply: the interview-hour cost to hire Node js developers at senior level is routinely 2–3x that of an equivalent junior requisition, because senior panels are staffed by your most expensive people.
Output of this phase: one number total recruiting cost for the baseline period and its split by internal/external. Two quarters of history is the minimum for a usable baseline; four is better.
Phase 3 How to Calculate Cost Per Quality Hire (the Blend)
With quality gated and cost totaled, the blend is one division:
Cost per quality hire (CPQH) = Total recruiting cost in period ÷ Number of hires who passed the quality gate
And its diagnostic twin, quality yield = quality hires ÷ total hires.
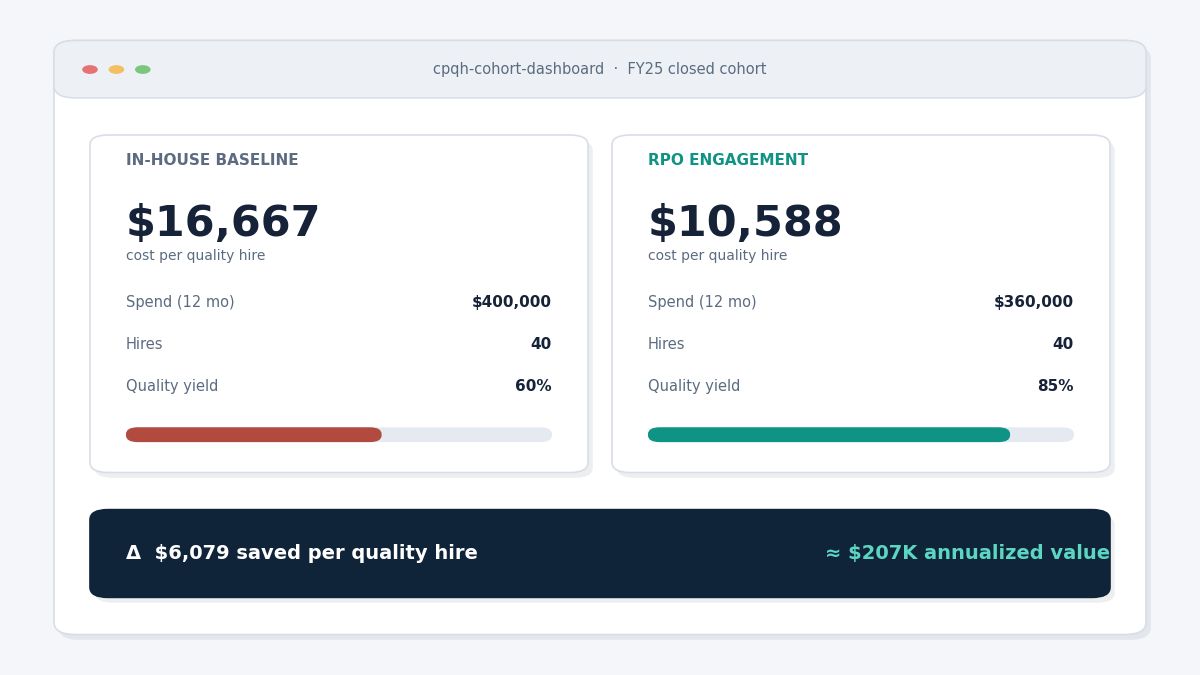
Worked example in-house baseline:
- Period: trailing 12 months
- Total recruiting cost (internal + external): $400,000
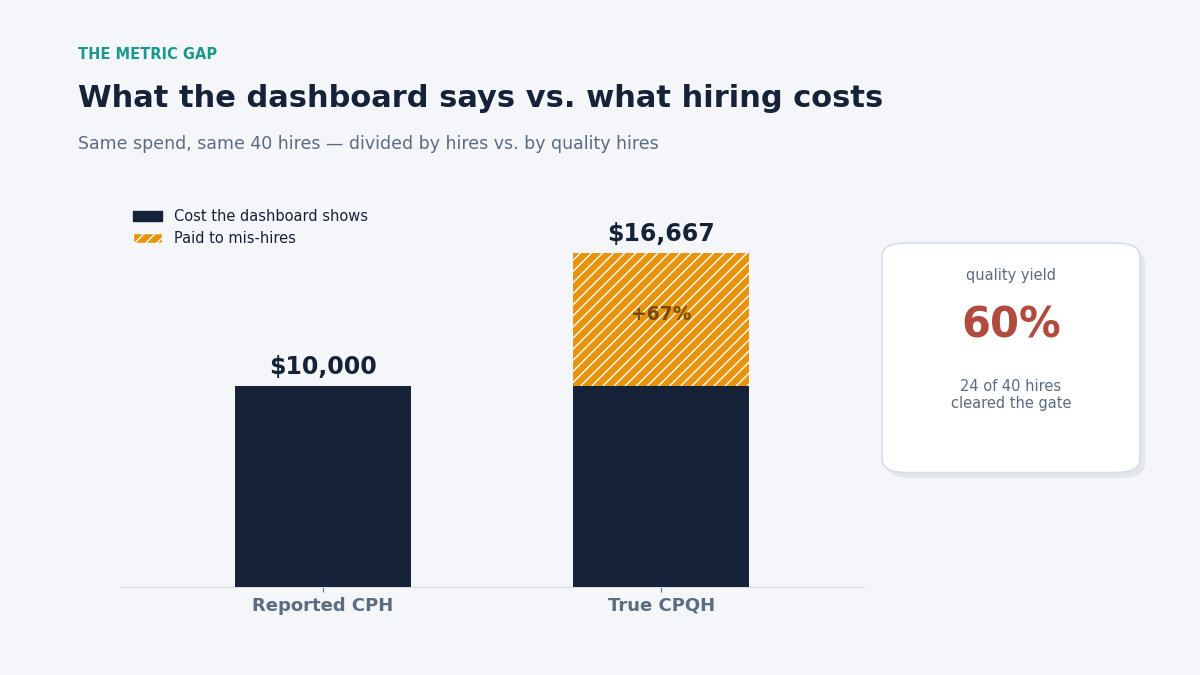
- Total hires: 40 → plain CPH = $10,000
- Hires passing the quality gate at 12 months: 24 → quality yield = 60%
- CPQH = $400,000 ÷ 24 = $16,667
That last line is the moment the room goes quiet. The dashboard said $10k; the truth is $16.7k a 67% markup paid entirely to mis-hires. In ₹ terms, a ₹33 lakh total spend across 4 quality hires out of 6 works identically: ₹5.5 lakh per hire on paper, ₹8.25 lakh per hire that mattered.
Now the RPO side of the ledger. Total engagement cost = RPO fees (management + per-hire) + your residual internal cost (the HM interview hours don’t vanish; recruiter cost mostly does) + transition/setup cost amortized over the term. Same formula:
- RPO engagement cost over 12 months: $360,000
- Hires: 40; quality-gate passers: 34 → quality yield = 85%
- RPO CPQH = $360,000 ÷ 34 = $10,588
The comparison that constitutes ROI: $16,667 − $10,588 = $6,079 saved per quality hire, × 34 quality hires ≈ $207k of annualized value before counting cost-of-vacancy savings from faster fills. That’s the skeleton of every credible pro cost per quality hire business case, and it’s exactly what the downloadable calculator at the end of this guide automates: you enter cost lines, hires, and gate-pass counts; it returns CPQH, quality yield, and the delta.
A lighter variant worth knowing the index-divisor method. Instead of a hard pass/fail gate, some teams divide plain CPH by the cohort’s average quality index expressed as a decimal: $10,000 ÷ 0.72 = $13,889.
The index method is gentler (a hire scoring 65 contributes partial value rather than zero) and suits smaller cohorts where a binary gate makes the number jumpy. The gate method is stricter and reads better in finance decks because “24 of 40 hires cleared the bar” is a sentence a CFO can repeat.
Pick one, document it, and never switch methods mid-engagement. A method change between baseline and verdict invalidates the comparison, and sharp procurement teams (on either side) know it.
Handling the timing problem: quality-gate results lag hires by 12 months. Run the model on cohorts “hires who started in Q1 FY25” and report each cohort when its window closes. For in-flight cohorts, report leading indicators only (90-day survival, HM satisfaction) and label them as provisional. Mixing closed and open cohorts in one number is the fastest way to lose finance’s trust.
Phase 4 Instrument the RPO Engagement (Contracts, SLAs, and the 3 Clauses That Matter)
A CPQH model with no contractual teeth is a scorecard the vendor can ignore. Before signing or at renewal, if you’re mid-term the measurement framework goes into the agreement. When we structure RPO services at Supersourcing, the engagements that run smoothest are the ones where the quality gate was in the SLA from day one, because both sides then optimize the same number; our own delivery model is built around that accountability (dedicated account managers, no shared recruiter bandwidth, and a replacement guarantee executed within 7–10 days when a hire isn’t a fit).
The 3 clauses that make the model enforceable:
- Quality-gate definition, verbatim. The exact index components, weights, threshold, and measurement windows from Phase 1 pasted into the SLA, not summarized. Ambiguity here becomes a dispute in month 13.
- Replacement and clawback terms tied to the gate. Free replacement for exits inside 90 days is table stakes; negotiate partial fee credits for hires that fail the 6-month early-exit flag. Watch the definitions “voluntary exit only” clauses quietly exclude performance terminations, which are half your quality failures.
- Data delivery obligations. The vendor must feed submittal-to-interview ratios, offer acceptance rate, joining rate, and source-of-hire into your ATS in your schema, monthly. If the data lives only in the vendor’s dashboard, you can’t audit the ROI claim at renewal.
Also negotiate, in order of leverage:
- Governance cadence: monthly ops review + quarterly business review with cohort-level CPQH on the QBR agenda
- Ramp-period fee relief (months 1–2 of an RPO are setup, not delivery pricing should reflect that)
- Exit assistance: knowledge transfer and pipeline handover terms, agreed while everyone’s still friendly
Negotiation detail that only shows up in practice: vendors will happily accept a quality-gate SLA but push the measurement window to 6 months, knowing most quality failures surface between months 7 and 12. Hold the 12-month window; concede on reporting frequency instead it costs you nothing.
Phase 5 Run the Measurement: Cadence, Dashboards, Governance
Live repo value measurement is a rhythm, not a report. The teams that get a clean verdict at month 12 all run some version of this cadence:
Monthly (ops review, 45 minutes):
- Funnel health: submittals, submittal-to-interview ratio, interview-to-offer, offer acceptance rate, joining rate
- Speed: time-to-shortlist and time-to-fill vs. SLA (for calibration: a well-run tech desk delivers an interview-ready shortlist in 7–10 working days from JD sign-off if you’re seeing 3+ weeks, that’s a sourcing problem, not a market problem)
- Cost run-rate vs. plan
Quarterly (QBR, with finance in the room):
- Cohort table: each hire cohort, its open/closed status, provisional vs. final quality yield
- Closed-cohort CPQH vs. the in-house baseline the only slide the CFO reads
- Leading-indicator drift: 90-day survival and HM satisfaction trending down is your 9-month early warning
- Corrective actions with owners on both sides
Annually: full-year CPQH, quality yield, and the renewal recommendation.
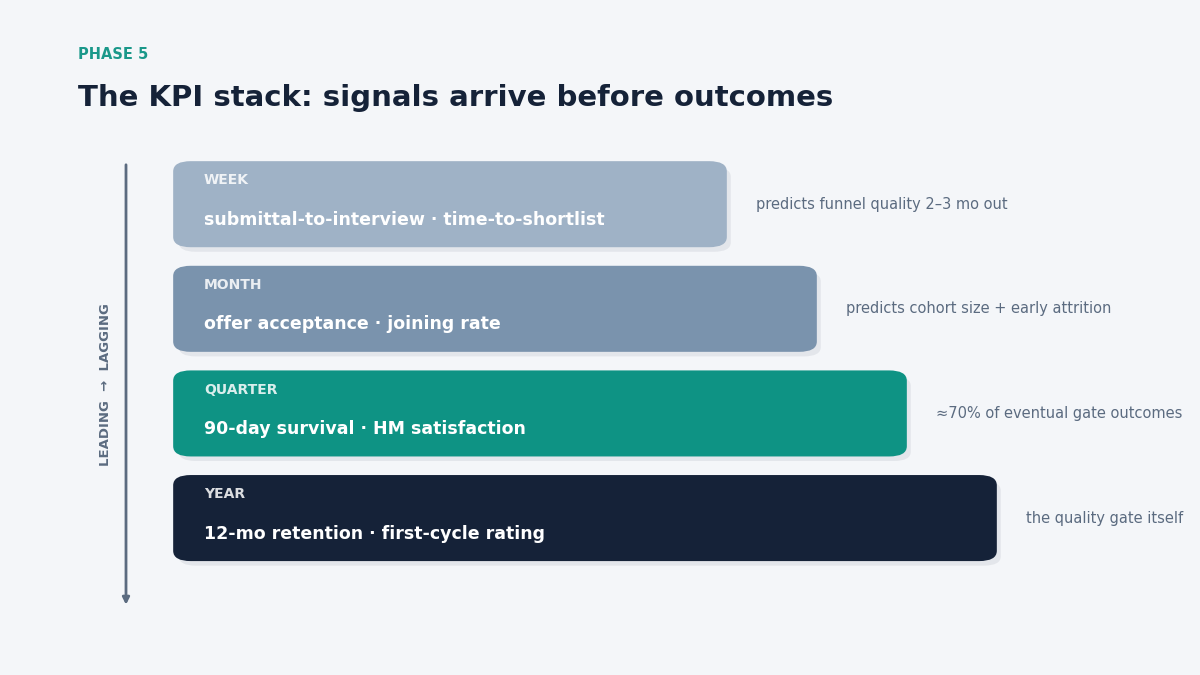
Leading vs. lagging the KPI stack: every metric in the cadence above sits at a known distance from the outcome. Reading them in order is what makes month-3 signals trustworthy:
- Week-level leading: submittal-to-interview ratio, time-to-shortlist predicts funnel quality 2–3 months out
- Month-level leading: offer acceptance rate, joining rate predicts cohort size and early attrition risk
- Quarter-level intermediate: 90-day survival, hiring manager satisfaction predicts roughly 70% of eventual gate outcomes in our experience, which is why the month-6 provisional read is worth taking seriously without being final
- Year-level lagging: 12-month retention, first-cycle rating the gate itself
When a lagging metric surprises you, the cause is almost always visible two levels up the stack, one or two quarters earlier. A quality-yield miss at month 12 traces back to a submittal-to-interview slide at month 4 that nobody escalated. Instrument the stack and the model stops being a scorecard and starts being an early-warning system.
The two-dashboard rule: keep an operational dashboard (funnel + speed, updated weekly, owned by TA) separate from the ROI dashboard (cohort CPQH, updated when cohorts close, owned jointly with finance). Merging them tempts everyone to judge ROI on funnel noise.
Phase 6 Turn the Number Into Decisions: Scale, Renegotiate, or Exit
The pro roi calculation formula, stated fully for the renewal memo:
RPO ROI % = (In-house baseline CPQH − RPO CPQH) × quality hires + cost-of-vacancy savings − transition costs, all ÷ total RPO fees × 100
Cost-of-vacancy savings deserve inclusion but conservative math: (baseline days-to-fill − RPO days-to-fill) × daily fully-loaded cost of the vacant seat × fills. Use 50% of the computed figure; nobody has ever lost credibility by discounting their own soft savings.
Decision thresholds that have held up in practice:
- RPO CPQH ≥20% below baseline, quality yield ≥80% → scale: add headcount, extend to new role families
- CPQH flat vs. baseline but quality yield up sharply → renegotiate pricing, keep the engagement you’re buying risk reduction, price it that way
- CPQH above baseline after two closed cohorts → structured exit: invoke pipeline handover, rebuild in-house or re-tender
- Quality yield <60% regardless of cost → the screening process is broken; fix or exit, don’t discount
Scaling checklist before you add scope:
- Two closed cohorts of data, not one (one cohort can be a market artifact)
- Replacement-guarantee utilization under ~10% of hires
- Vendor data feeds passing your audit (Phase 4, clause 3)
- Internal HM interview load sustainable at the higher volume RPO scales sourcing, not your panel hours
Case Studies: What the Model Looks Like at Enterprise Scale
Three engagement patterns from Supersourcing’s delivery history show the metric doing real work. (Figures cited are the engagement-level outcomes we publish and stand behind; client-internal financials stay confidential.)
Paytm 100+ engineers, quality yield as the scaling gate. Hiring past the hundred-engineer mark is where quality yield usually collapses, volume pressure erodes screening rigor quarter by quarter. Running the engagement against a joining-rate and retention scorecard instead of a fills-per-month scorecard kept the funnel honest: sourcing stayed restricted to the pre-vetted top 2% of the talent pool even as monthly volume tripled, and the 98% candidate joining rate meant offer-stage leakage the silent CPQH killer at scale stayed near zero.
Swiggy hiring scale-up under time-to-shortlist SLAs. Hypergrowth hiring turns cost-of-vacancy into the dominant term of the ROI equation: every week an engineering seat sits open costs more than the recruiting fee ever will. Holding delivery to a 7–10 working day JD-to-shortlist SLA compressed the vacancy window per requisition, which is exactly the lever that shows up as the “cost-of-vacancy savings” line in the Phase 6 formula.
Somnoware recruitment automation feeding the quality index. For a healthtech engineering team, the constraint wasn’t sourcing volume but signal: distinguishing genuinely strong candidates in a niche stack. AI-assisted screening and structured technical vetting raised the submittal-to-interview ratio fewer, better candidates per requisition which is the earliest leading indicator in the model that a cohort’s eventual quality yield will land high.
Pattern across all three: the metric that predicted 12-month success was never speed alone. It was joining rate plus submittal-to-interview ratio the two numbers a vendor can’t inflate without actually screening better.
Decision Framework: Quality-Adjusted Cost Per Hire vs. Every Other Way to Judge Hiring
Teams evaluating an RPO business case are usually choosing between four measurement approaches, mostly by inertia. Quality adjusted cost per hire the CPQH family wins on decision usefulness, but it’s worth seeing the honest trade-offs:
| Approach | What it optimizes | Blind spot | Data lift | Best for |
| Plain cost per hire | Cheap fills | Mis-hires invisible; rewards corner-cutting | Low | Budget tracking only |
| Time-to-fill / speed SLAs | Fast fills | Quality and cost both invisible | Low | Hypergrowth vacancy pressure |
| QoH survey scores alone | Hire quality | No cost linkage; can’t produce ROI | Medium | Manager calibration |
| CPQH (this guide) | Cost of successful outcomes | 12-month lag to final numbers | Medium-high | RPO ROI, renewal decisions, CFO cases |
How to choose in 60 seconds:
- Fewer than ~15 hires/year → CPQH cohorts are too small to be statistically meaningful; use QoH scores + plain CPH side by side, or pool 2 years per cohort.
- 15–50 hires/year → annual cohorts, CPQH as the headline metric.
- 50+ hires/year → quarterly cohorts, CPQH by role family; this is where the model starts steering vendor mix, e.g., which roles stay with IT staffing services on a per-placement basis versus which move into the RPO scope.
One framework rule: never let a metric with a shorter feedback loop (time-to-fill) override a metric with a longer one (quality yield) in the same decision. Short-loop metrics steer weekly operations; long-loop metrics steer contracts.
What Most Teams Get Wrong About Measuring RPO ROI
Patterns repeat across dozens of engagements, and they’re rarely the mistakes the RPO literature warns about. The quotable version: most RPO ROI cases fail not because the vendor underdelivered, but because the buyer measured a number the vendor was never incentivized to move. The specifics:
- They baseline after signing. The single most expensive sequencing error. Post-hoc baselines get negotiated, disputed, and eventually ignored. Capture two quarters of in-house CPQH before the RFP goes out even if a rough version beats a contested one.
- They let the vendor’s dashboard be the system of record. If renewal-time numbers come from the party being renewed, the audit is theater. Data feeds into your ATS, your schema (Phase 4, clause 3), non-negotiable.
- They judge a 12-month metric at month 6. Quality failures cluster in months 7–12 after ramp, after the first performance cycle, after the honeymoon. A month-6 verdict systematically flatters the engagement. Use leading indicators at 6 months; withhold the verdict until a cohort closes.
- They count fee savings and ignore internal cost shifts. RPO removes recruiter cost but not panel cost. Teams that report “40% cheaper” are usually comparing vendor fees to fully loaded in-house costs an apples-to-forklift comparison finance will eventually catch.
- They treat quality yield as the vendor’s number alone. A hire who fails because onboarding was chaos or the manager churned is not a screening failure. Mature scorecards attribute gate failures to a cause bucket (sourcing/screening vs. onboarding vs. management) before assigning them to the vendor and this shared accountability is also where the impact of RPO on employer brand shows up, since candidate experience failures depress offer acceptance long before they depress retention.
- They optimize CPQH down instead of quality yield up. Past a point, cutting cost per quality hire means cheaper sourcing and thinner screening which cuts quality yield and raises CPQH next year. The durable lever is yield: moving 60% → 85% did more in the Phase 3 worked example than any fee negotiation could.
Cost & Timeline Reality Check
The section competing articles skip, because ranges require commitment. These are typical market bands that treat them as calibration, not quotes; role mix, volume, and geography move every one of them.
RPO pricing models, and when each makes sense:
| Model | Typical structure | Fits when |
| Per-hire fee | Flat fee or % of CTC per join in Indian tech hiring, RPO per-hire economics typically land meaningfully below the 15–25%-of-CTC contingency-agency band | Volume is lumpy or uncertain |
| Management fee | Fixed monthly fee for a dedicated recruiting pod | Volume is steady, 8+ hires/month |
| Hybrid | Reduced monthly fee + smaller per-hire success fee | Most enterprise engagements aligns incentives on both throughput and outcomes |
| Project RPO | Fixed price for a defined ramp (e.g., 30 engineers in 2 quarters) | GCC builds, new-site ramps, product-team spin-ups |
Cost drivers, up and down:
- Up: senior/niche stacks (staff+ backend, ML, platform), multi-geo hiring, heavy compliance screening, sub-2-week fill SLAs
- Down: volume commitments, longer terms, standardized role families, your own interview process being fast (panel latency is the most common SLA-buster on the buyer’s side)
What the internal side still costs you during an RPO: budgeting teams routinely zero out internal recruiting cost the day the contract starts. Don’t. Panel interview hours persist in full; expect a part-time TA ops owner (0.25–0.5 FTE) to manage the vendor relationship, data feeds, and QBRs; and onboarding cost is untouched by who sourced the hire.
In most engagements, 20–35% of the pre-RPO internal cost base survives and it belongs in the numerator of your engagement CPQH, or the ROI comparison quietly flatters the vendor.
Honest timeline to a defensible ROI number:
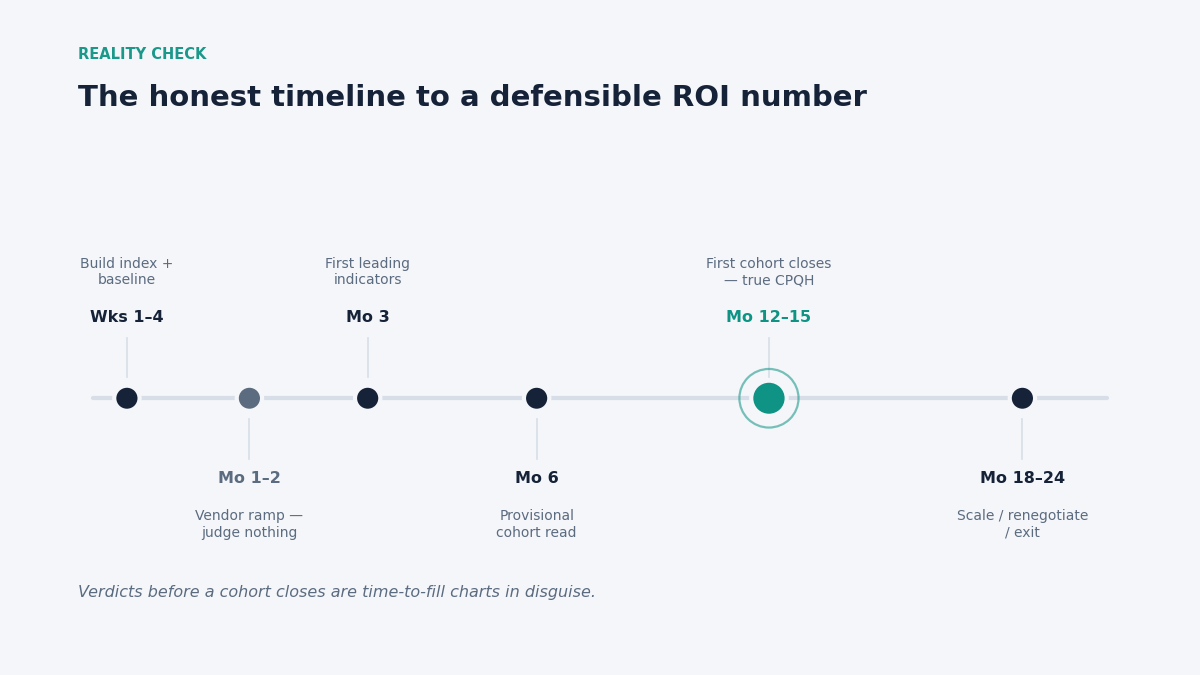
- Weeks 1–4: build the quality index, run the three-table join, compute the historical baseline
- Months 1–2 of engagement: vendor ramp expect partial throughput; judge nothing yet
- Month 3: first leading indicators worth reading (shortlist speed, submittal-to-interview, joining rate)
- Month 6: provisional cohort read 90-day survival + HM satisfaction; renegotiate operational issues here
- Months 12–15: first cohort closes; first true CPQH comparison
- Months 18–24: two closed cohorts; scale/renegotiate/exit decision on solid ground
Budget planning anchor: whatever plain CPH your finance model currently assumes, a realistic quality-adjusted figure runs 1.3 — 1.7x that until proven otherwise (the quality-yield range of 60–75% most teams discover in their first baseline). Plan reserves accordingly and let the model earn the number down.
Next Step: Pressure-Test Your Model Before You Sign (or Renew)
If you’re mid-decision, do this in order: pull the five data fields from Phase 1 for last year’s hires, compute your quality yield, and run your first CPQH number through the downloadable cost-per-quality-hire calculator attached to this guide. That single number tells you whether an RPO conversation is about saving money, buying quality, or both.
Then, if you want the model stress-tested against real engagement data pricing bands for your role mix, SLA language for the quality gate, and what your first two cohorts should realistically look like book a 30-minute working session with the Supersourcing team: https://supersourcing.com/contact-us/. Bring your baseline; we’ll bring the benchmarks.
FAQ
How do you calculate cost per quality hire?
Divide total recruiting cost for a period (internal + external, per the SHRM/ANSI standard) by the number of hires from that period who passed your quality gate typically 12-month retention plus an on-target first performance rating. Track it by cohort so lagging quality data doesn’t contaminate in-flight periods. The companion metric, quality yield, is quality hires divided by total hires.
What’s the difference between cost per hire and cost per quality hire?
Cost per hire divides spend by all hires; cost per quality hire divides the same spend by only the hires that worked out. If your quality yield is 60%, CPQH runs about 1.67x your CPH. The gap between the two numbers is, quite literally, what mis-hiring costs you per successful hire.
Is RPO cheaper than in-house recruiting?
On plain fees, not always a good in-house team at steady volume can match RPO per-hire costs. On a quality-adjusted basis, RPO wins when it lifts quality yield (better screening, higher joining rates) and compresses vacancy time. Run both sides through the CPQH formula; the answer is empirical, not ideological.
How much does RPO cost in India?
Structures vary: monthly management fees for dedicated pods, per-hire fees, or hybrids. As calibration, per-hire RPO economics for tech roles typically undercut the 15–25%-of-CTC contingency-agency band, with volume commitments pushing rates down further. Getting quotes priced against your role mix at a blended rate quoted without seeing your requisition list is a red flag in itself.
How long before an RPO engagement shows ROI?
Leading indicators (shortlist speed, submittal-to-interview ratio, joining rate) are readable by month 3. A provisional quality read arrives at month 6. The first fully defensible cost-per-quality-hire comparison lands when your first cohort’s 12-month window closes months 12–15. Any vendor or stakeholder promising a “proven ROI” figure at month 4 is selling you a time-to-fill chart.
Does RPO improve quality of hire or just speed?
It can do either, depending on what the contract rewards. Engagements scored on fills-per-month buy speed; engagements with a quality gate in the SLA buy screening rigor structured technical vetting, tighter shortlists, higher joining rates. The instrument determines the outcome, which is why Phase 4 puts the gate into the contract verbatim.
Is RPO worth it for startups with low hiring volume?
Below roughly 15 hires a year, a full enterprise RPO rarely pencils out, cohorts are too small to measure and management fees dominate. Project RPO for a defined ramp, or per-placement staffing for individual roles, usually fits better. Reassess when you cross ~1–2 hires a month sustained.
What should I benchmark my numbers against?
External benchmarks (SHRM’s ~$4,700 average CPH, agency fee bands) calibrate expectations, but the benchmark that decides your RPO renewal is internal: your own pre-engagement baseline. If you’re building that baseline now and want a second set of eyes on the model weights, gates, cost inventory that’s a working session worth having with a partner who runs these engagements daily.
